We've pretty aggressively integrated AI, especially Claude, first into our data analyst workflows, then into our data engineering processes. Our data analyst team on a delivery project is basically acting as context engineers, orchestrating AI to write code, design mockups, and build data models.
The productivity multipliers are kind of insane. The reasoning models that dropped in late 2025 were a turning point, for BI and reporting specifically.
This post shows what agentic BI for business intelligence looks like in practice, the concepts, and the concrete workflow shifts, and most importantly, what we've seen on real projects.
Problems with classic BI delivery
The whole pipeline used to take weeks. In classic BI workflows, a business analyst interviews stakeholders and writes a requirements spec. That spec goes to a data engineer, who builds the data layer. That passes to a BI developer, who builds the report. Then UAT, then revisions, then the business realizes the requirements shifted two months ago. Start over. So the whole pipeline takes weeks, sometimes months.
When something in the source data changes, like a renamed column, or a new business entity added, the whole thing breaks, and someone has to manually chase it through the stack. And the analyst spends most of their time on these banalities. Similarly tedious is the daily, repetitive query writing, maintaining fragile dashboards, and just playing telephone between business and engineering.
This is what agentic BI disrupts.
Building the semantic backbone: context engineering and ontologies
Modern data teams are evolving into context engineers to build machine-readable AI ontologies that serve as the brain for agentic workflows. By codifying KPI taxonomies, business entities, and stakeholder logic into a formal semantic layer, you provide AI agents with a "map" of how the business actually functions rather than just how the tables are joined. This durable context layer enables agents to reason accurately, ensuring that when source data evolves, the entire reporting ecosystem updates consistently and automatically.
What the agentic BI workflow actually looks like
The classical BI workflow has a linear handoff chain:
Requirements → KPI Documentation → Data Layer → Semantic Model → Report Design → Development & Testing → Distribution
Across multiple people, multiple weeks, and many translations.
The agentic workflow restructures this into three phases:
Initiate → Orchestrated Build Loop → Productionize
Initiate
In the Initiate phase, the context engineer captures requirements and structures them into the context/ontology layer. This is still human work, but it's higher-order work. More like a system architect, not the note-taker intern.
Orchestrate Build Loop
The Build Loop is where the real productivity multiplier lives. AI agents handle data model scaffolding, semantic modeling, report prototyping, and iterative testing. The human expert reviews, provides feedback, and that feedback refines the context, which then restarts the loop. The AI isn't running unsupervised, commands are approved by a human in the loop at every decision point. We just stay out of the weeds of implementation.
Productionize
Productionization, including governance, distribution, documentation, all stays largely human-led, but with a critical difference. The context layer that was built during the project becomes the documentation. It's not a separate artifact someone has to write afterward, but already there, automatically. That’s a huge time saver.
Total value: 60% lower cost of ownership, 5-10x multiplier on analyst output, 10x on time-to-insight.
These are the numbers we have seen on live projects, not just projections and wishful estimates.
Agentic BI in production: Real-world examples
To respect the non-disclosure agreements and proprietary interests of our partners, the following case studies have been anonymized. While specific client identities remain confidential, the project scopes and architectural outcomes accurately reflect our recent enterprise engagements:
Reporting a step ahead of the data at a major media company
We've been running a large-scale Power BI refactoring engagement for one of the biggest media companies in Europe (think national TV broadcasting plus a streaming platform with a large subscriber base). The existing setup had 16 Power BI workspaces, business logic scattered across DAX and M-code in dozens of reports, conflicting KPI definitions across teams, and no single source of truth.
The agentic approach changed how we kicked off the reporting work.
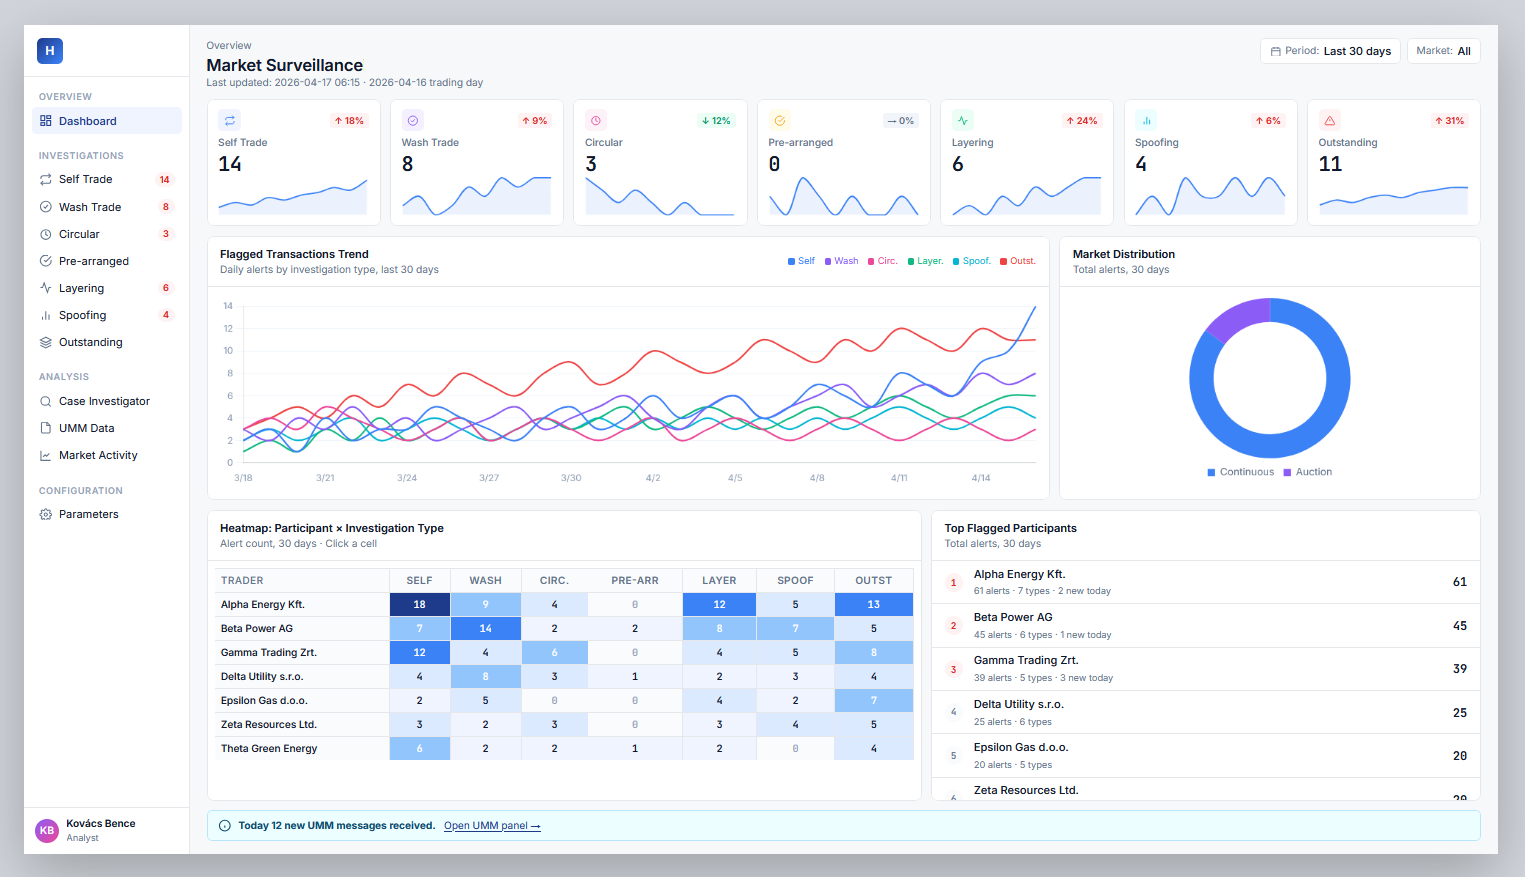
Example: a full Power BI-style dashboard mockup generated from a business brief and context documentation, before any production data pipeline existed
Before the data engineering team had finished building the gold layer in Databricks, we were able to generate full report mockups from the context documentation and business brief alone. Stakeholders saw something that looked and behaved like the real dashboard, with real KPI definitions, real filter logic, and real layout, before a single production pipeline was written. They gave feedback on the preview, and that feedback shaped the semantic model and the gold layer design.
This used to be impossible.
You couldn't get useful feedback from a business stakeholder on a data model spec document. Now they react to something they can actually interact with, and those reactions get baked into the architecture. The feedback loop is upstream of the build.
On the data engineering side: all the cross-workspace manual data tables (SharePoint sources, various operational files) were mapped, documented in the context layer, and handed to the data engineering team with full lineage. The context layer propagates changes automatically: when source files evolve, the downstream impact is visible and manageable. The system expects change, instead of breaking when it encounters it.
Real-time operational BI for a healthcare institution managing 100+ facilities
The other project that really crystallized the new paradigm for us was with a large national healthcare institution.
They manage a network of hospitals, clinics, and facilities running on a unified data platform.
The classic problem in healthcare reporting: there are always new stakeholders, facilities being shuffled through the system, new source files, or changing definitions. In the traditional model, you build a reporting pipeline and a dashboard, and when something changes underneath it, it breaks. Someone has to go fix it, which means a work order, a ticket. So everything is constantly out of sync.
The ontology-driven approach changes this at the architectural level. The system models every entity, facility, patient cohort, care pathway, staffing category, KPI, and their relationships. When a new facility is onboarded or a source data file changes its structure, those changes propagate through the context layer and the reporting layer reflects them. No more manual chasing is needed, because the system is defined to expect evolution.
Concretely: the demo output we built was a full operational dashboard covering staffing, patient flow, treatment financials, and wait lists, all filterable by facility, department type, and time period. This was built from a structured brief before the final data warehouse was complete. Stakeholders validated the report design early, caught definitional issues in the KPIs (what counts as an "urgent" waitlist entry, how bed occupancy is calculated), and those inputs shaped the actual data model. By the time the production build happened, there were no surprises.
How the agentic approach transforms the data analyst role
Let me be direct about this, because there's a lot of noise in the "AI is coming for your job" discourse that isn't useful.
The parts of the data analyst job that are going away are the parts nobody liked anyway: writing the same boilerplate query for the fifteenth time, maintaining dashboards that break every time a source changes, sitting in meetings to explain what a metric means because it's not written down anywhere.
What you get in return is operating at a level that simply wasn't available before. Not because you weren't capable of it, but because there was never capacity for it. But now?
Greenfield data modeling. Cross-functional process optimization. Ontology design. High-level architectural decisions about what KPIs should exist and how they should relate to each other.
This transformation opens up a new kind of work for analysts — one that simply wasn't available before, not because the capability wasn't there, but because there was never capacity for it. Greenfield data modeling, ontology design, high-level decisions about what KPIs should exist and how they should relate to each other. That’s context engineering.
That's the job now.
Engineers and software developers working in agentic workflows are doing their own version of this trend: less time on boilerplate, more time on architecture, system design, and the hard problems that actually require deep technical judgment. Different crafts, but same general direction.
How and where to start with agentic BI
None of this works without solid data foundations. We want to be clear about that because there's a lot of hype selling agentic BI as a magic layer you can bolt onto a mess and get insight out of.
The AI is only as good as the data it's reasoning from.
If your semantic layer is undefined, the agent will produce confident-sounding garbage. Generative models have no innate resistance to hallucination, they need a very well-structured foundation to stay grounded.
The entry point is a focused project, not a full transformation program.
- Pick one high-value reporting use case.
- Do the context engineering properly: document the KPIs, the entities, the business logic, the stakeholder decisions.
- Run the agentic build loop.
- Measure the output against your baseline for time, quality, and revision cycles.
You'll know within a few weeks whether this is real. Based on what we've seen, you will.
The context layer you build today grows and improves with every use case. That's the flywheel that will result in full transformation.