In the last few years, several modern self-service analytics tools have been released into the data world. They tackle some of the decade-old blockers that prevent a wider audience from extracting value from the company’s data assets.
Tools for metadata management
The rise of AI elevated a long-standing trend: self-service needs rich, up-to-date, and easy-to-process documentation on data assets.
Self-service users (consumers) can’t work from undocumented institutional memory or from reverse-engineering existing pipelines. Although these practices were—and in many places still are—more widespread than we like to admit.
Even more than humans, LLMs thrive on (verbal) context. So to fuel their appetite, there has been an explosion of metadata tools.
To make sense of data
Metadata stores
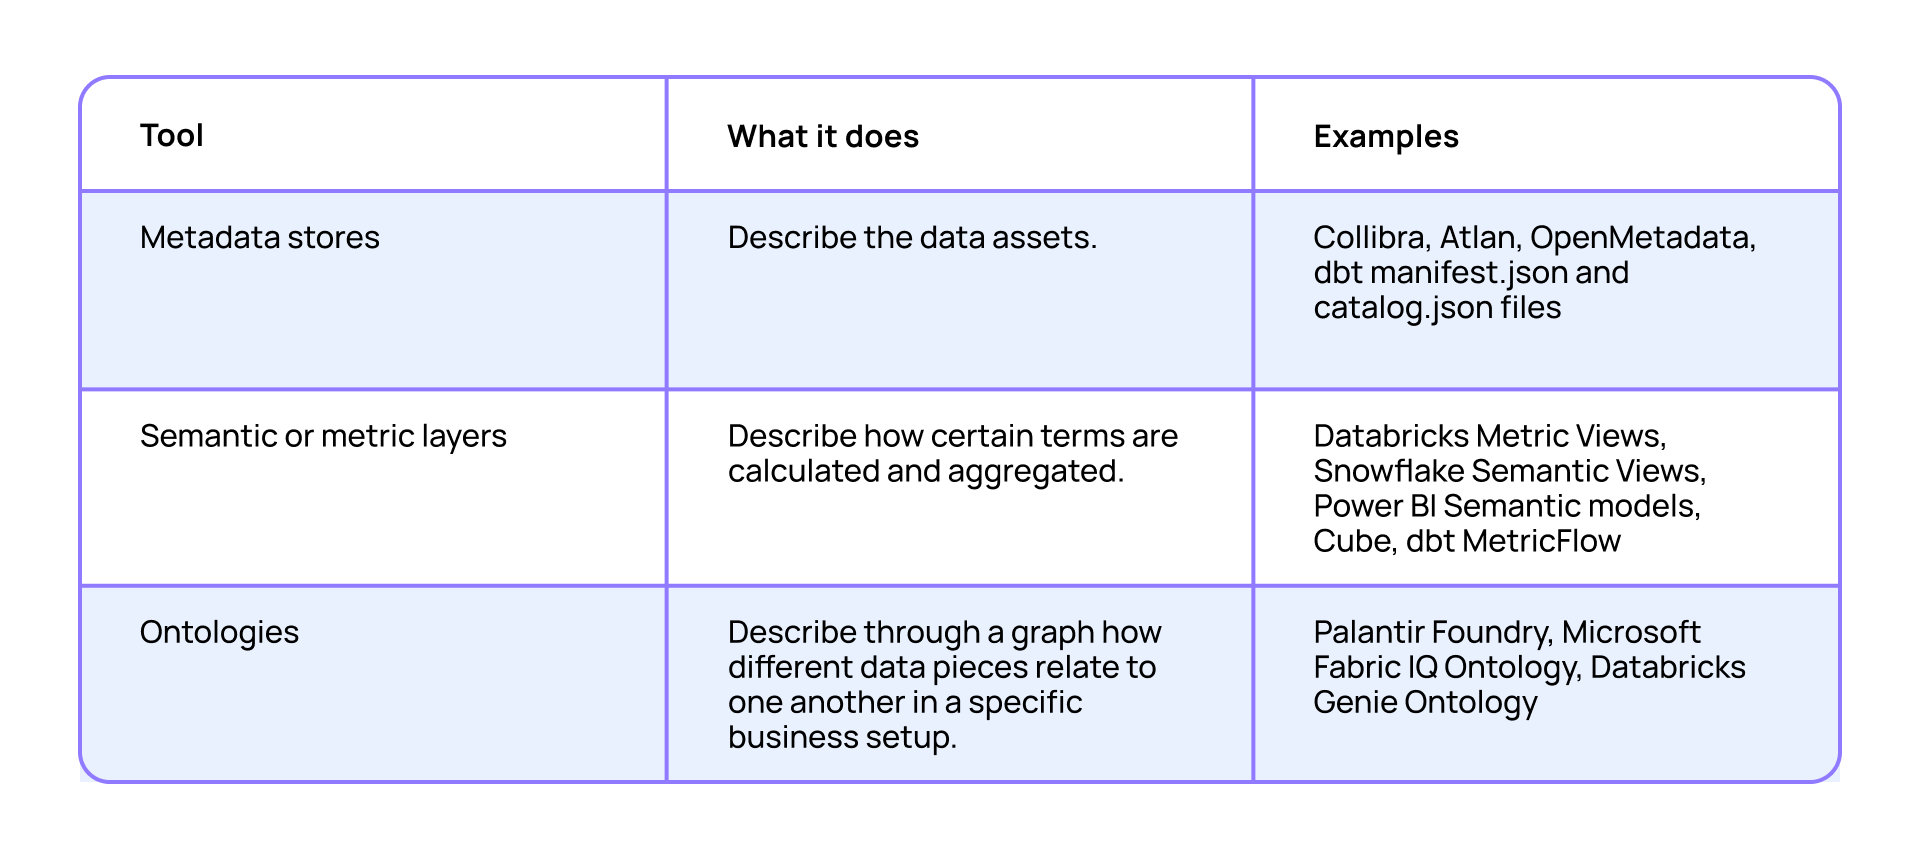
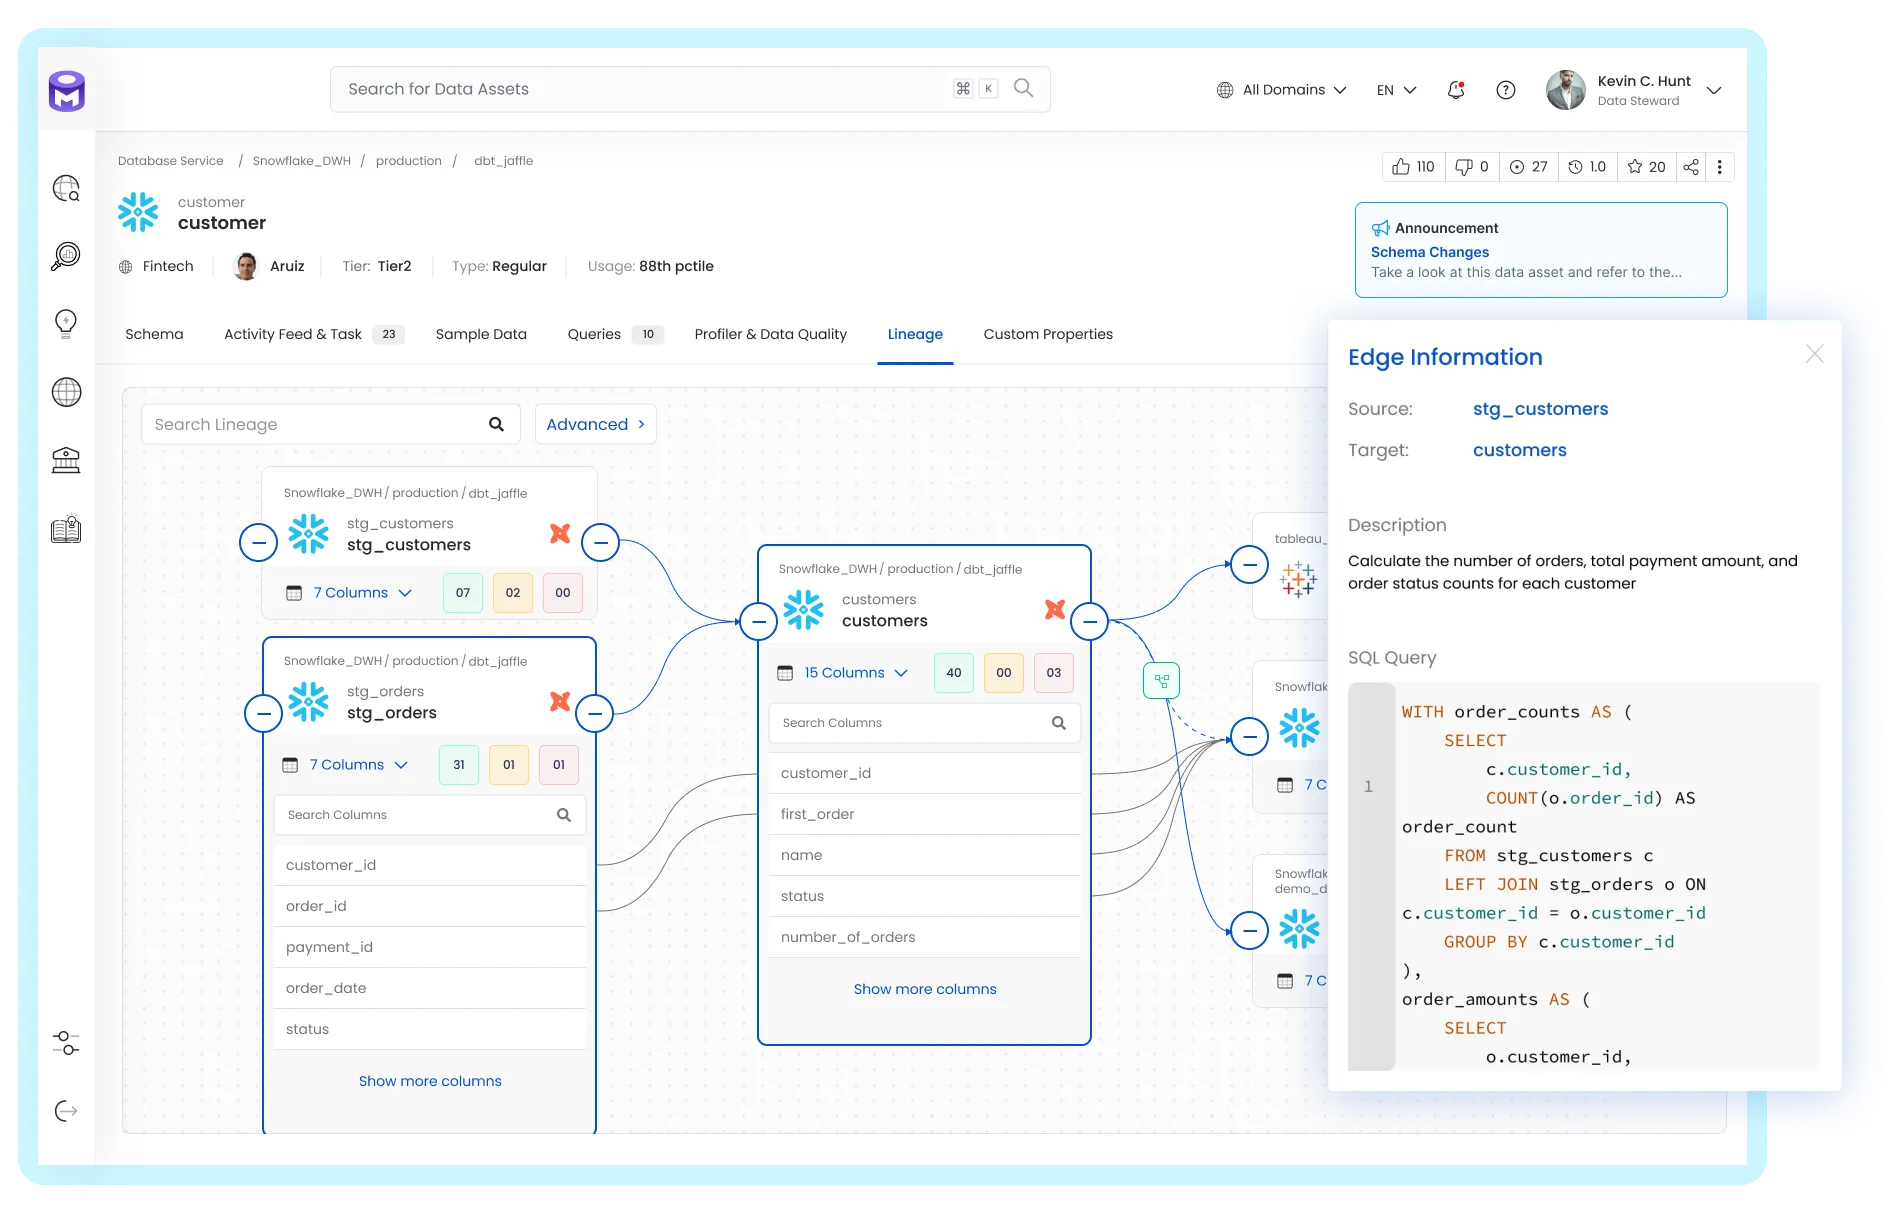
Metadata stores describe data assets. There are many types of useful descriptions, from business content description through lineage (what this data is based on) to data quality/statistics (if metadata is filled or empty in most cases).
Nearly all major data platforms have metadata stores built-in.
Examples of metadata stores: Independent examples are Collibra, Atlan, OpenMetadata, or dbt’s manifest and catalog JSON files.
Semantic or metric layers
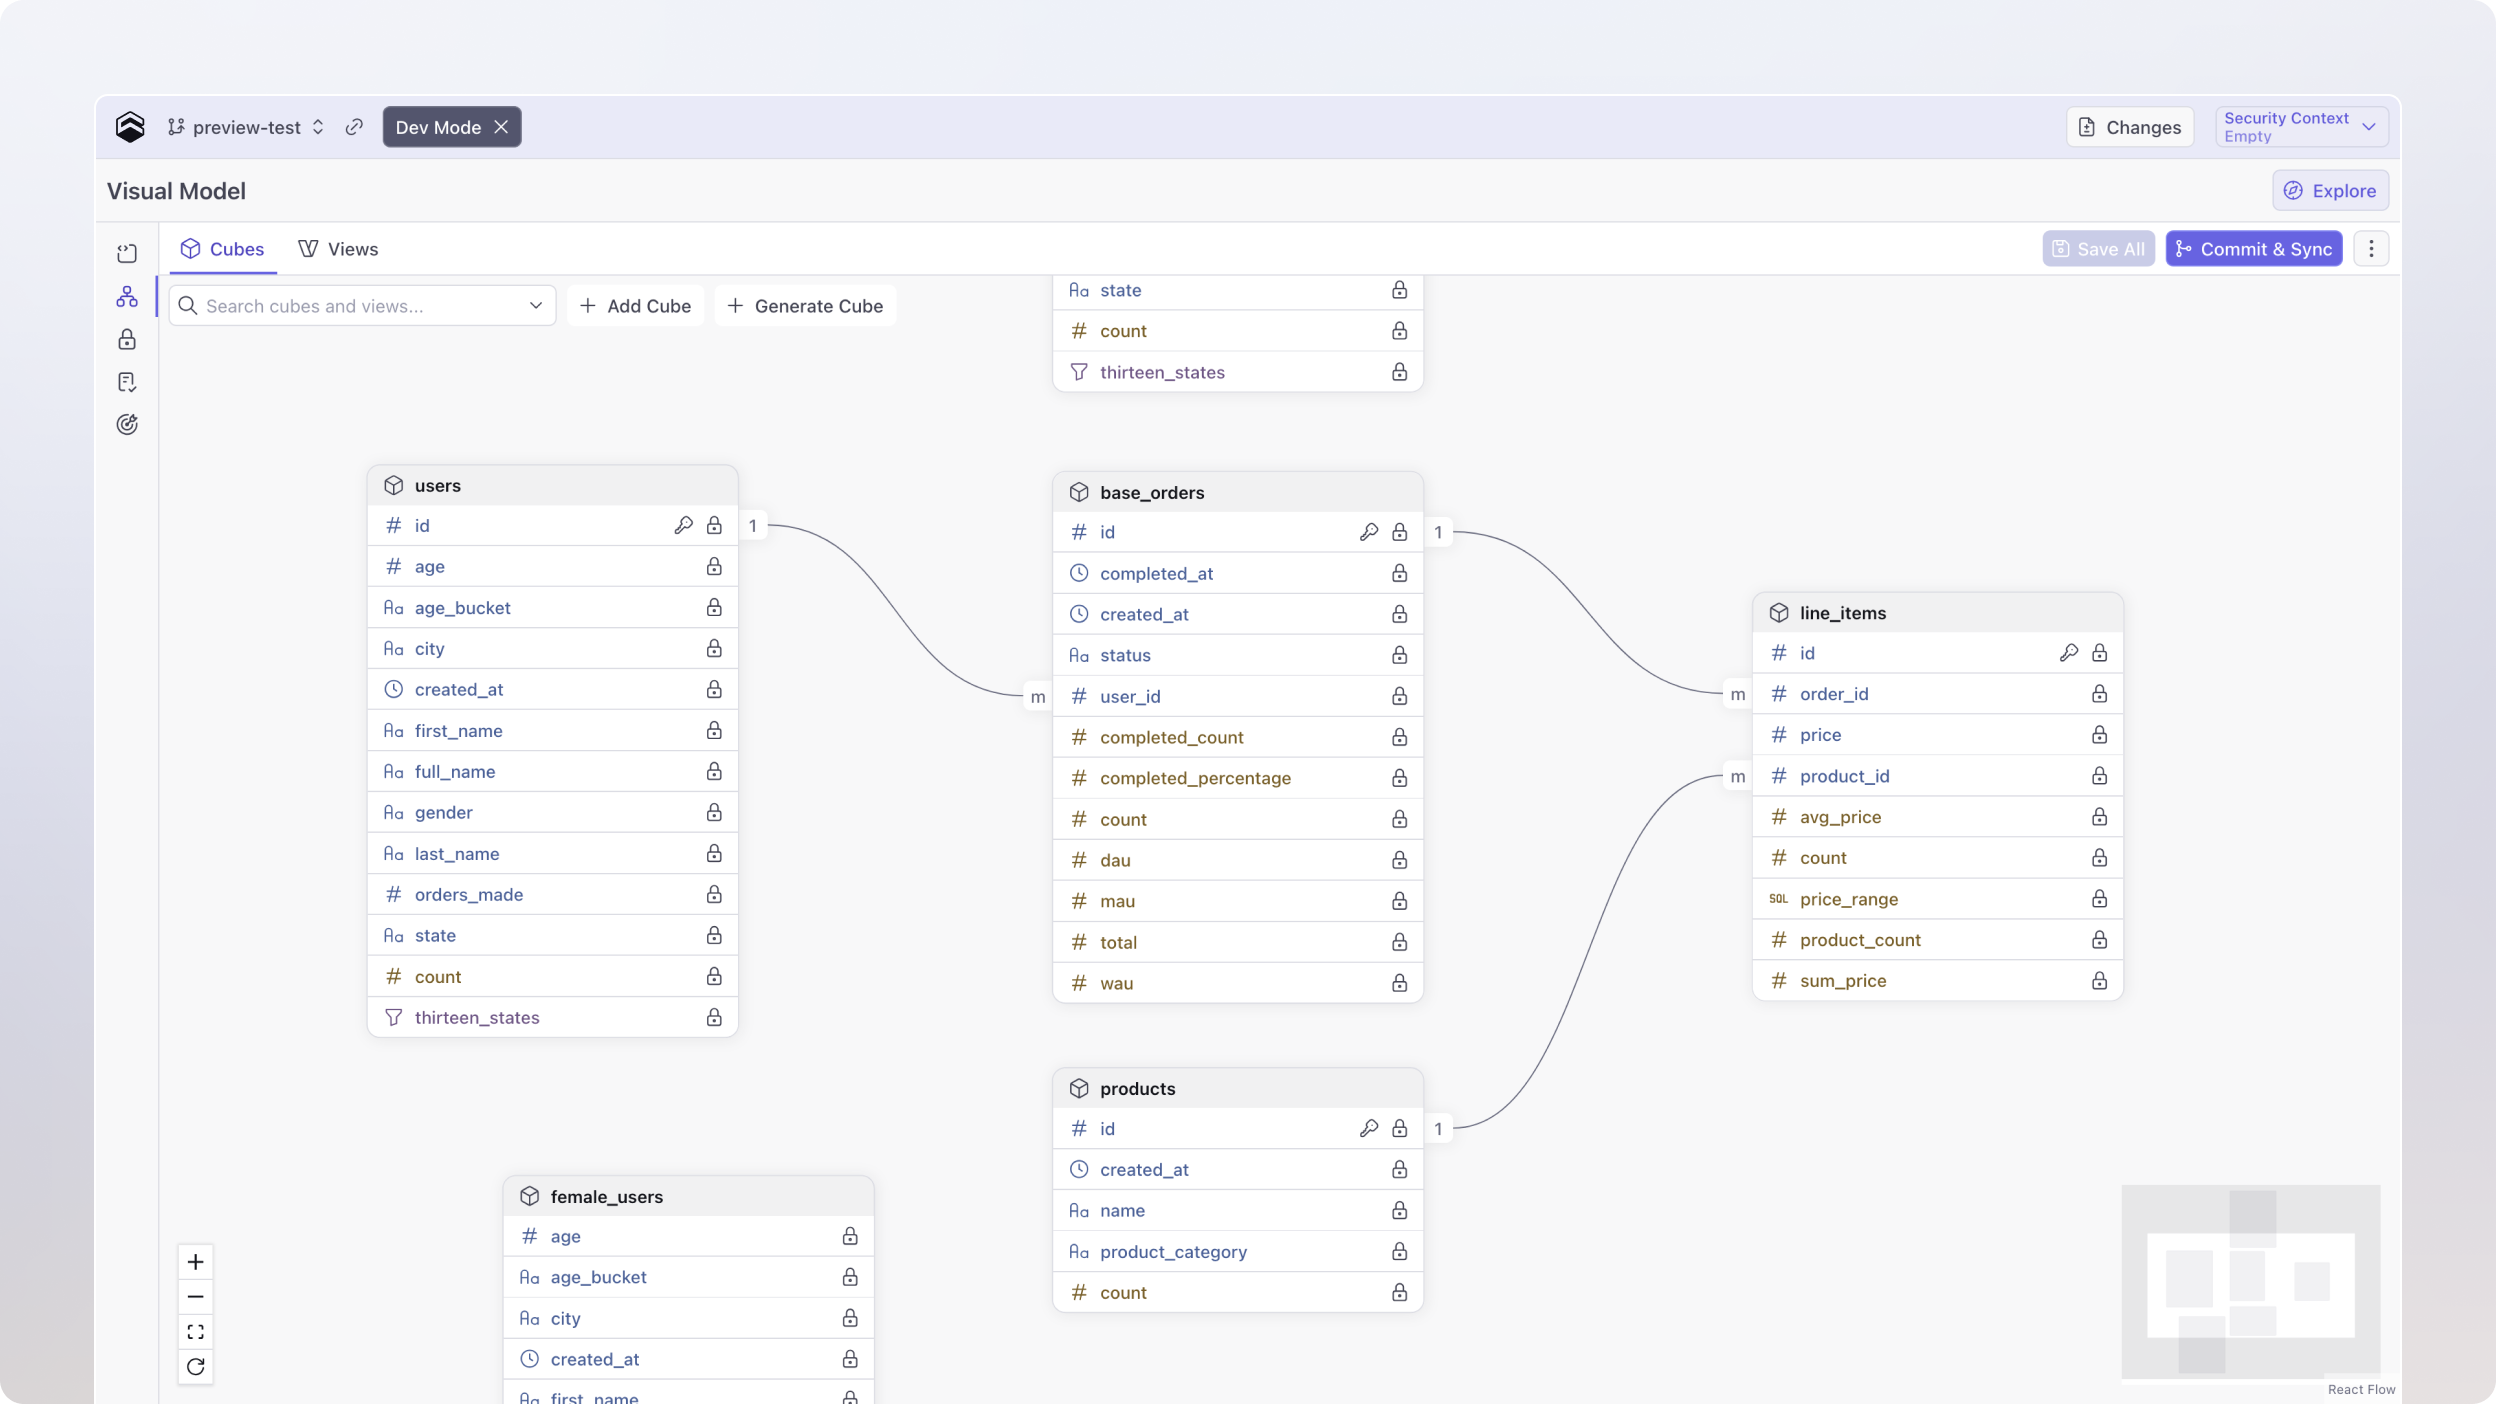
Semantic or metric layers describe how certain terms (KPIs) have to be calculated and aggregated.
Examples of metric layers: Beyond the large platforms’ own tools like Databricks Metric Views, Snowflake Semantic Views, or Power BI semantic models, some of the premier players are Cube and dbt’s MetricFlow.
Ontologies
Ontologies represent through a graph how different data pieces within an organization relate to one another and to business entities (processes, domains, rules, organizational units, etc.). They have been around for quite some time but had less visibility and were mostly classified as knowledge management tools.
With the rise of LLMs, ontologies are trending because they can provide rich and compact context to LLMs.
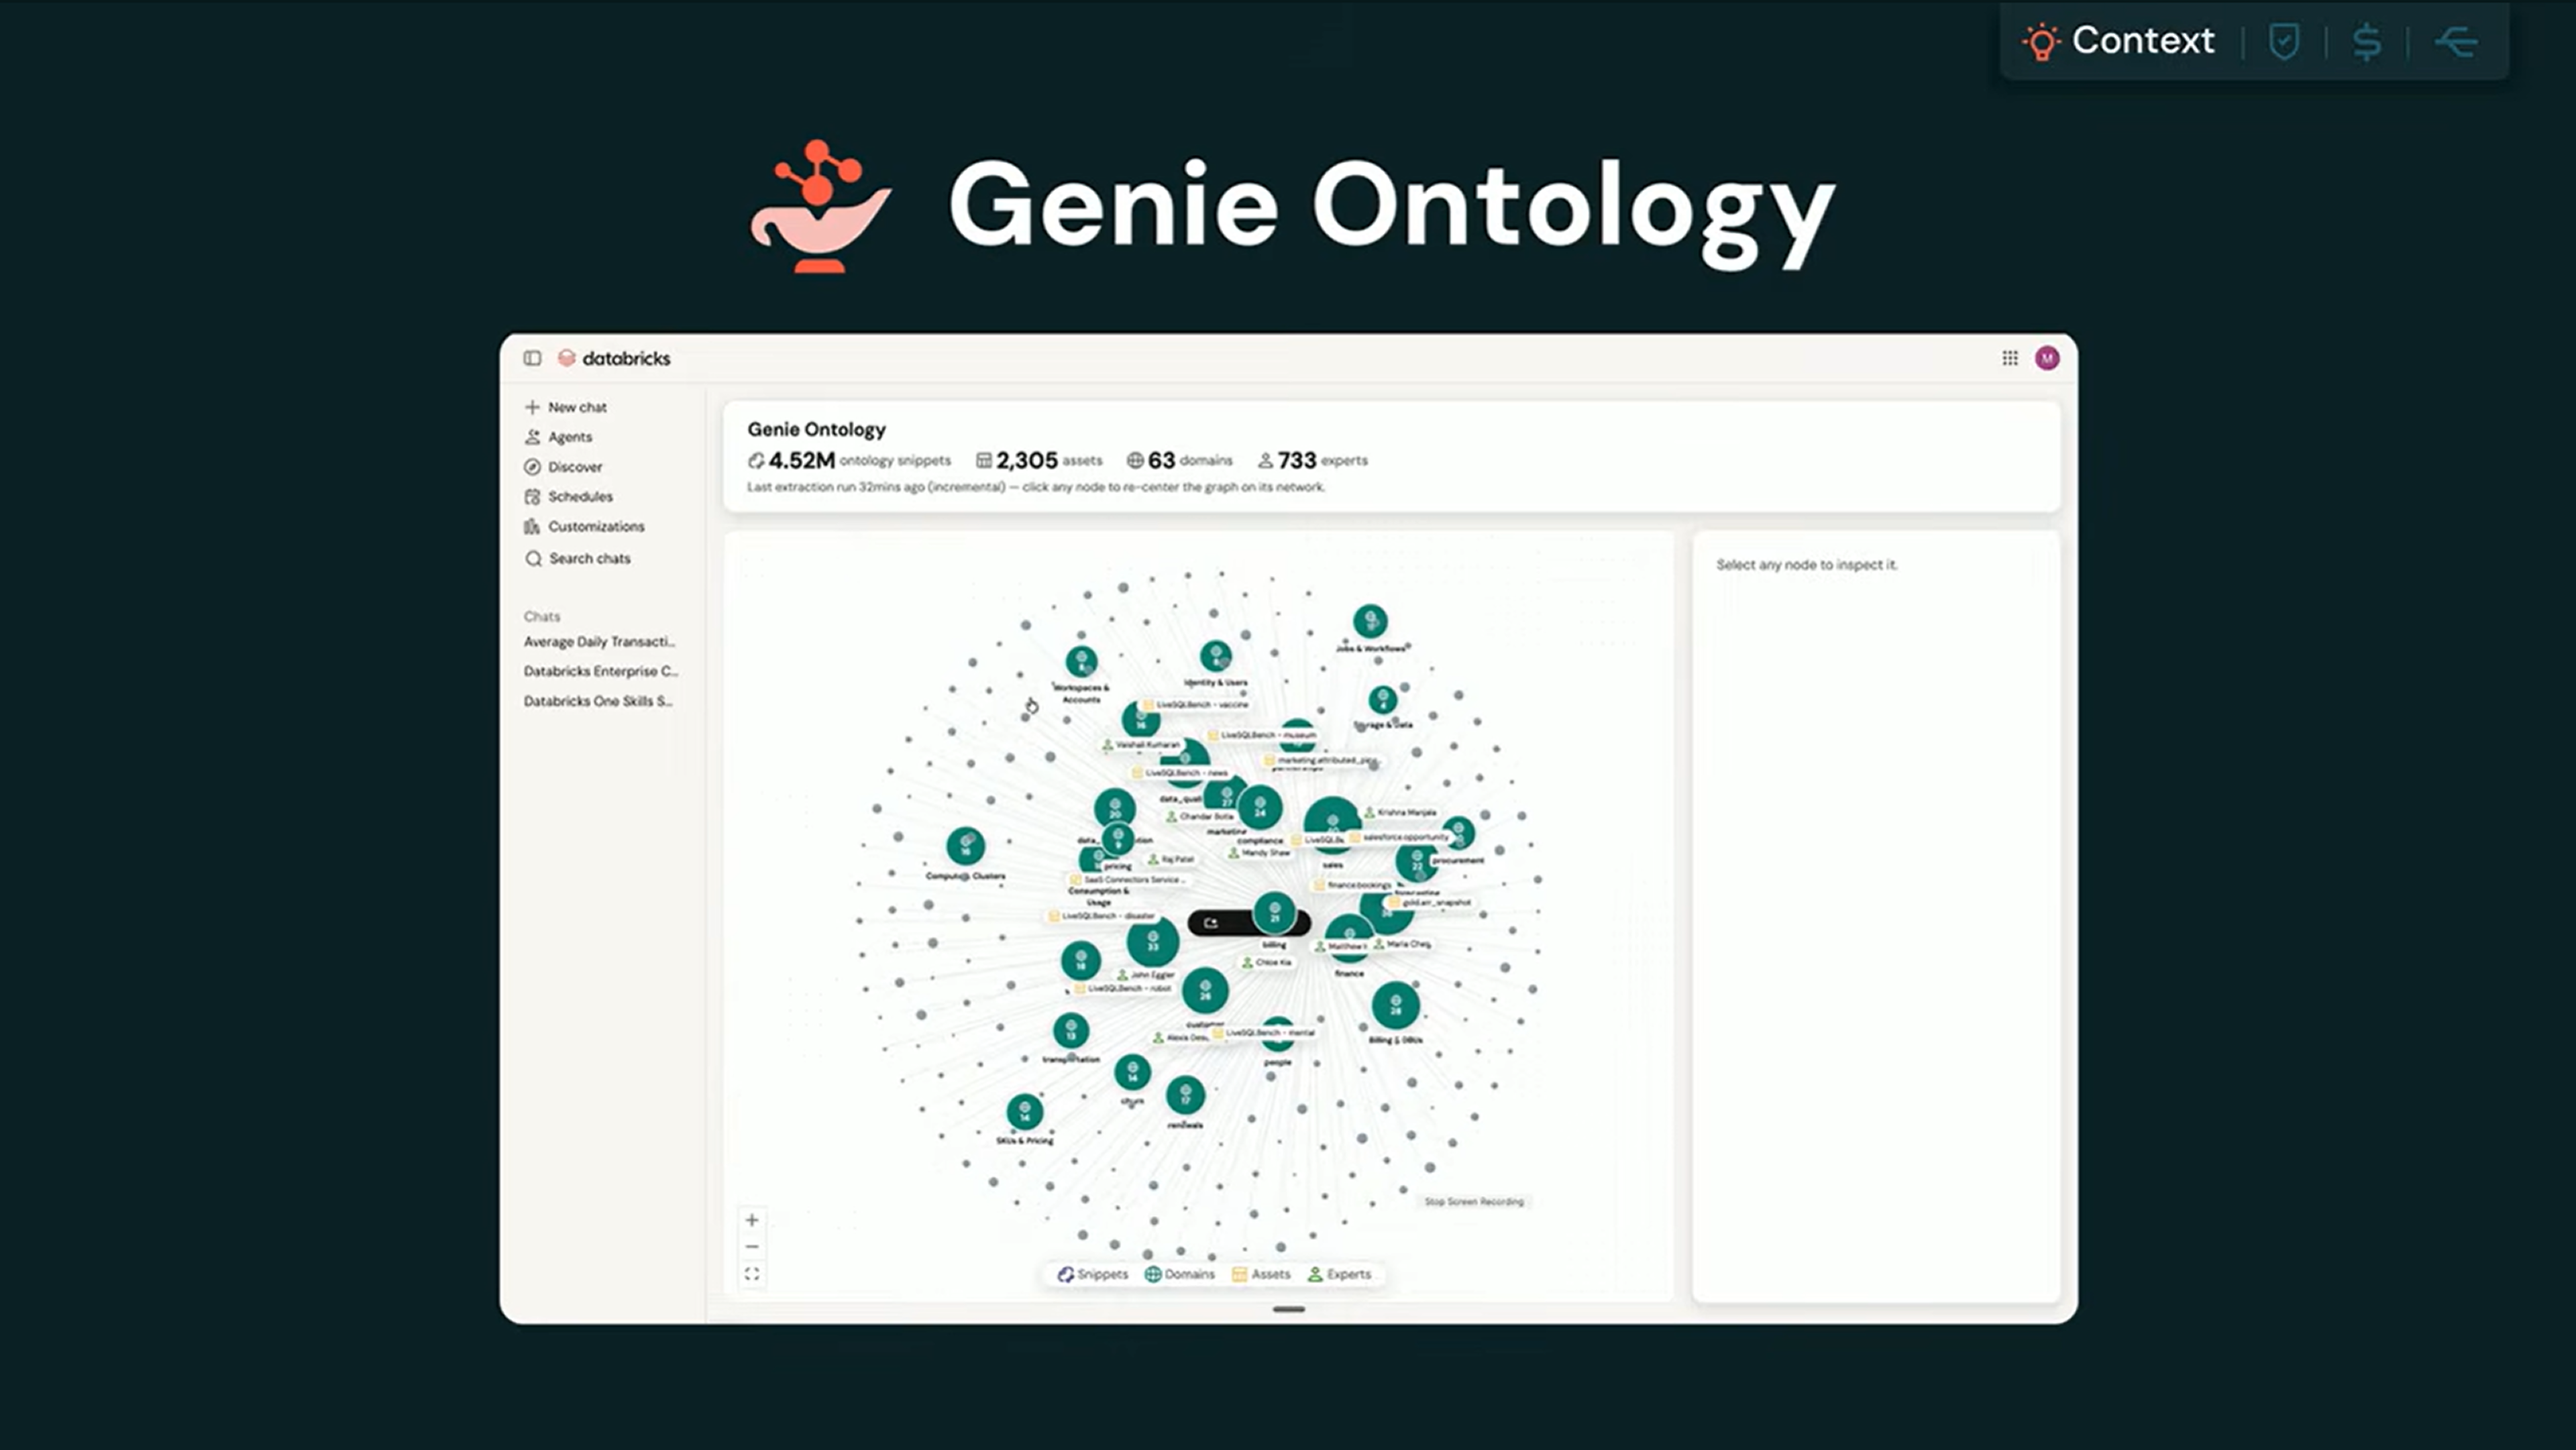
Examples of ontologies: The best-known example is perhaps Palantir Foundry, but others, such as Microsoft Fabric IQ Ontology and Databricks Genie Ontology, are catching up fast.
To generate metadata
Metadata generation is a big challenge in metadata management. Some of the key pieces of metadata are business meaning and usage patterns/limitations. And these are really hard to gather, primarily because it requires humans to collect, codify, and maintain them.
Most (if not all) modern tools augment humans with deterministic or LLM-based approaches to generate and maintain metadata.
Obviously, the level of automation they provide varies. And compiling a comprehensive attribute set over enterprise-wide data assets still has a non-trivial human effort component.
Databricks Genie Ontology, however, takes it to an extreme: it claims to generate ontology-level metadata fully automatically, using existing data relations (foreign keys), usage patterns and queries, and other signals. It obviously heavily depends on LLM inference and continuous learning.
So the loop closes:
AI generates the metadata it uses to serve self-service analytics users.
Interfaces for self-service analytics
Another major progress in self-service analytics has been coming from the evolution of user interfaces.
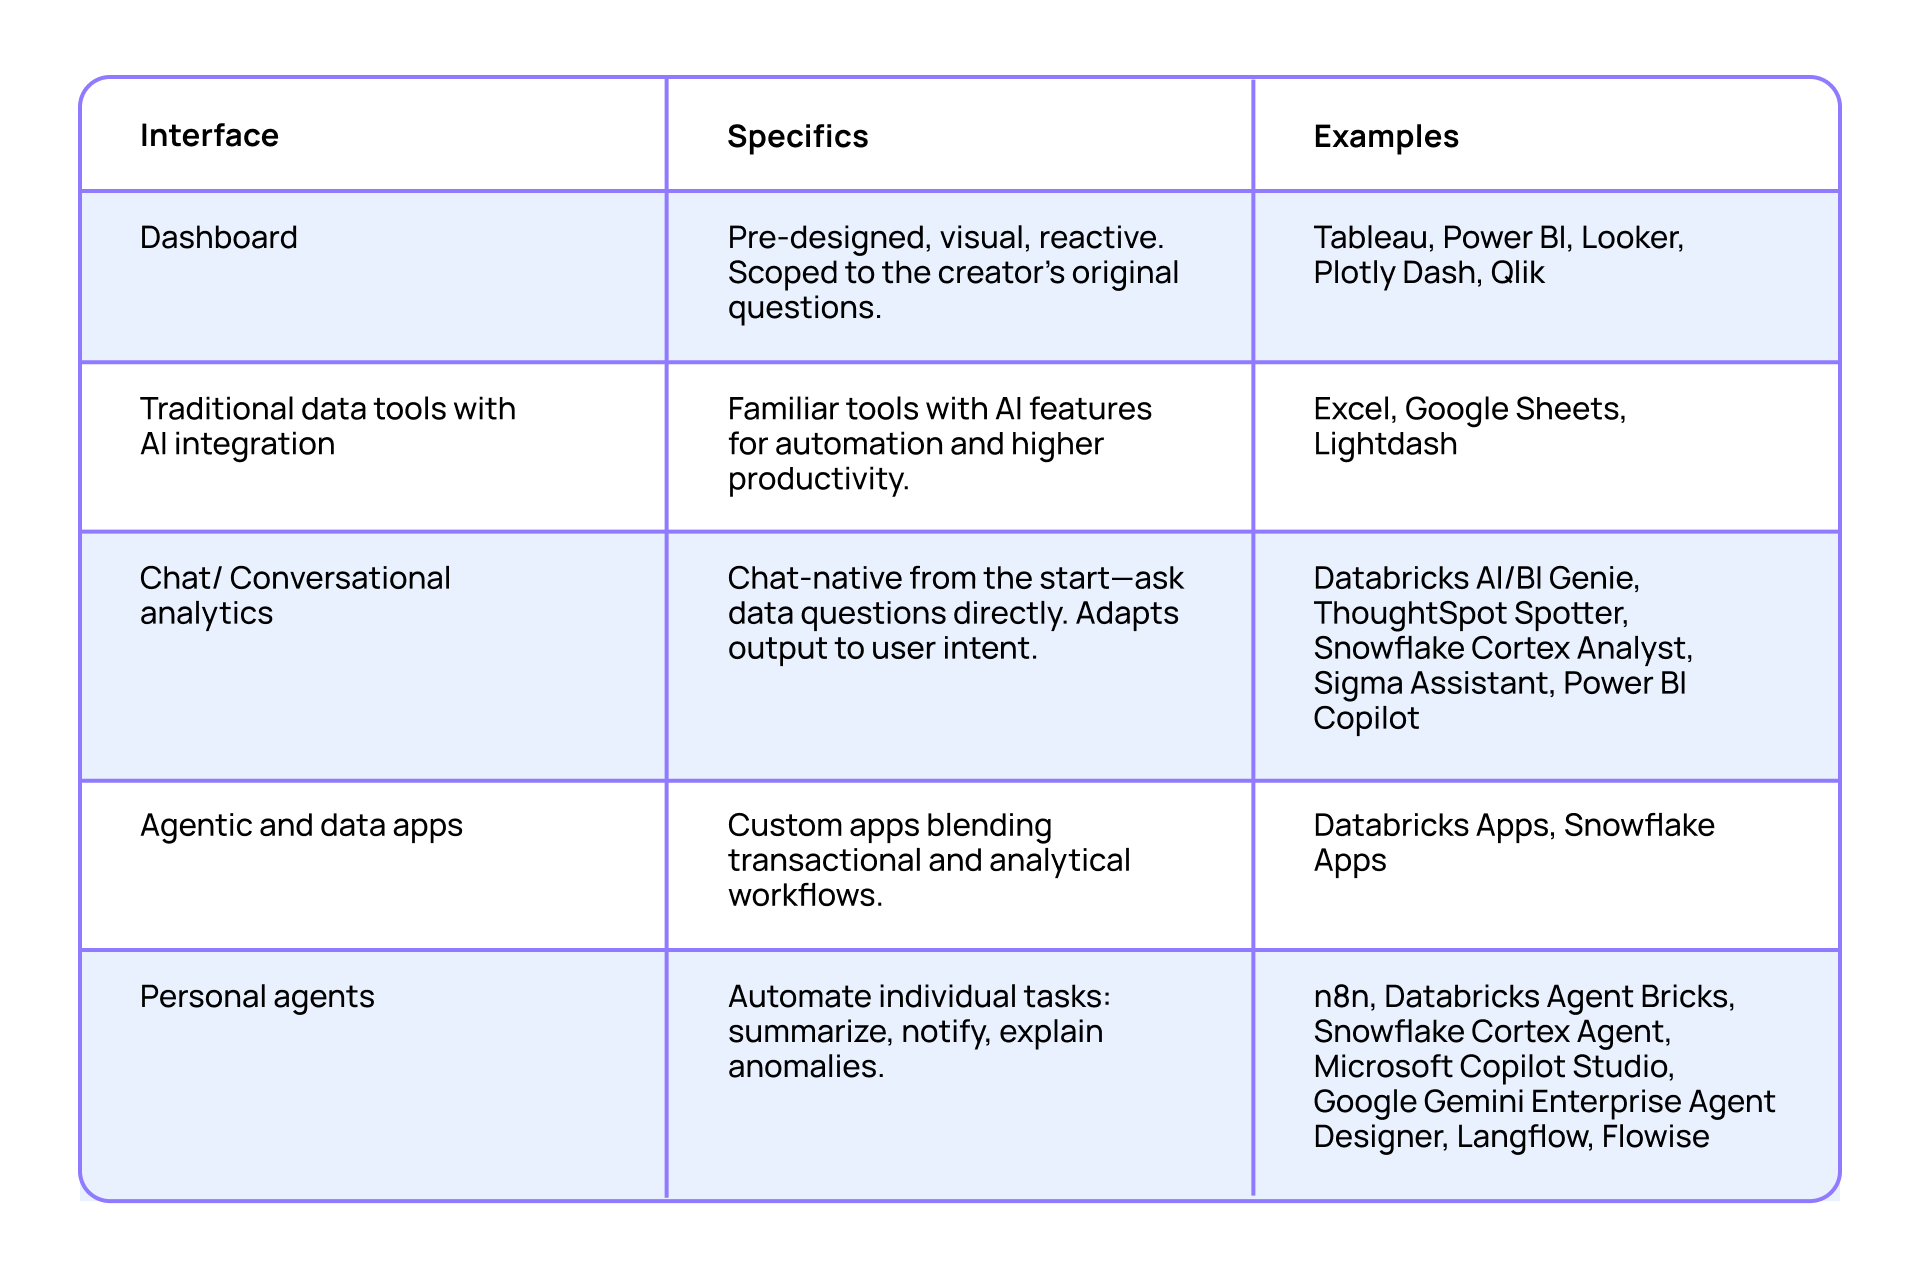
Traditional data tools with AI integration
People have been doing data work with many tools: dashboards, spreadsheets, SQL editors, just to name a few. A large swath of self-service users are intimately familiar with these tools, even to the point of not wanting to part with them.
In the last few years, most of these tools have adopted LLM-based functionalities.
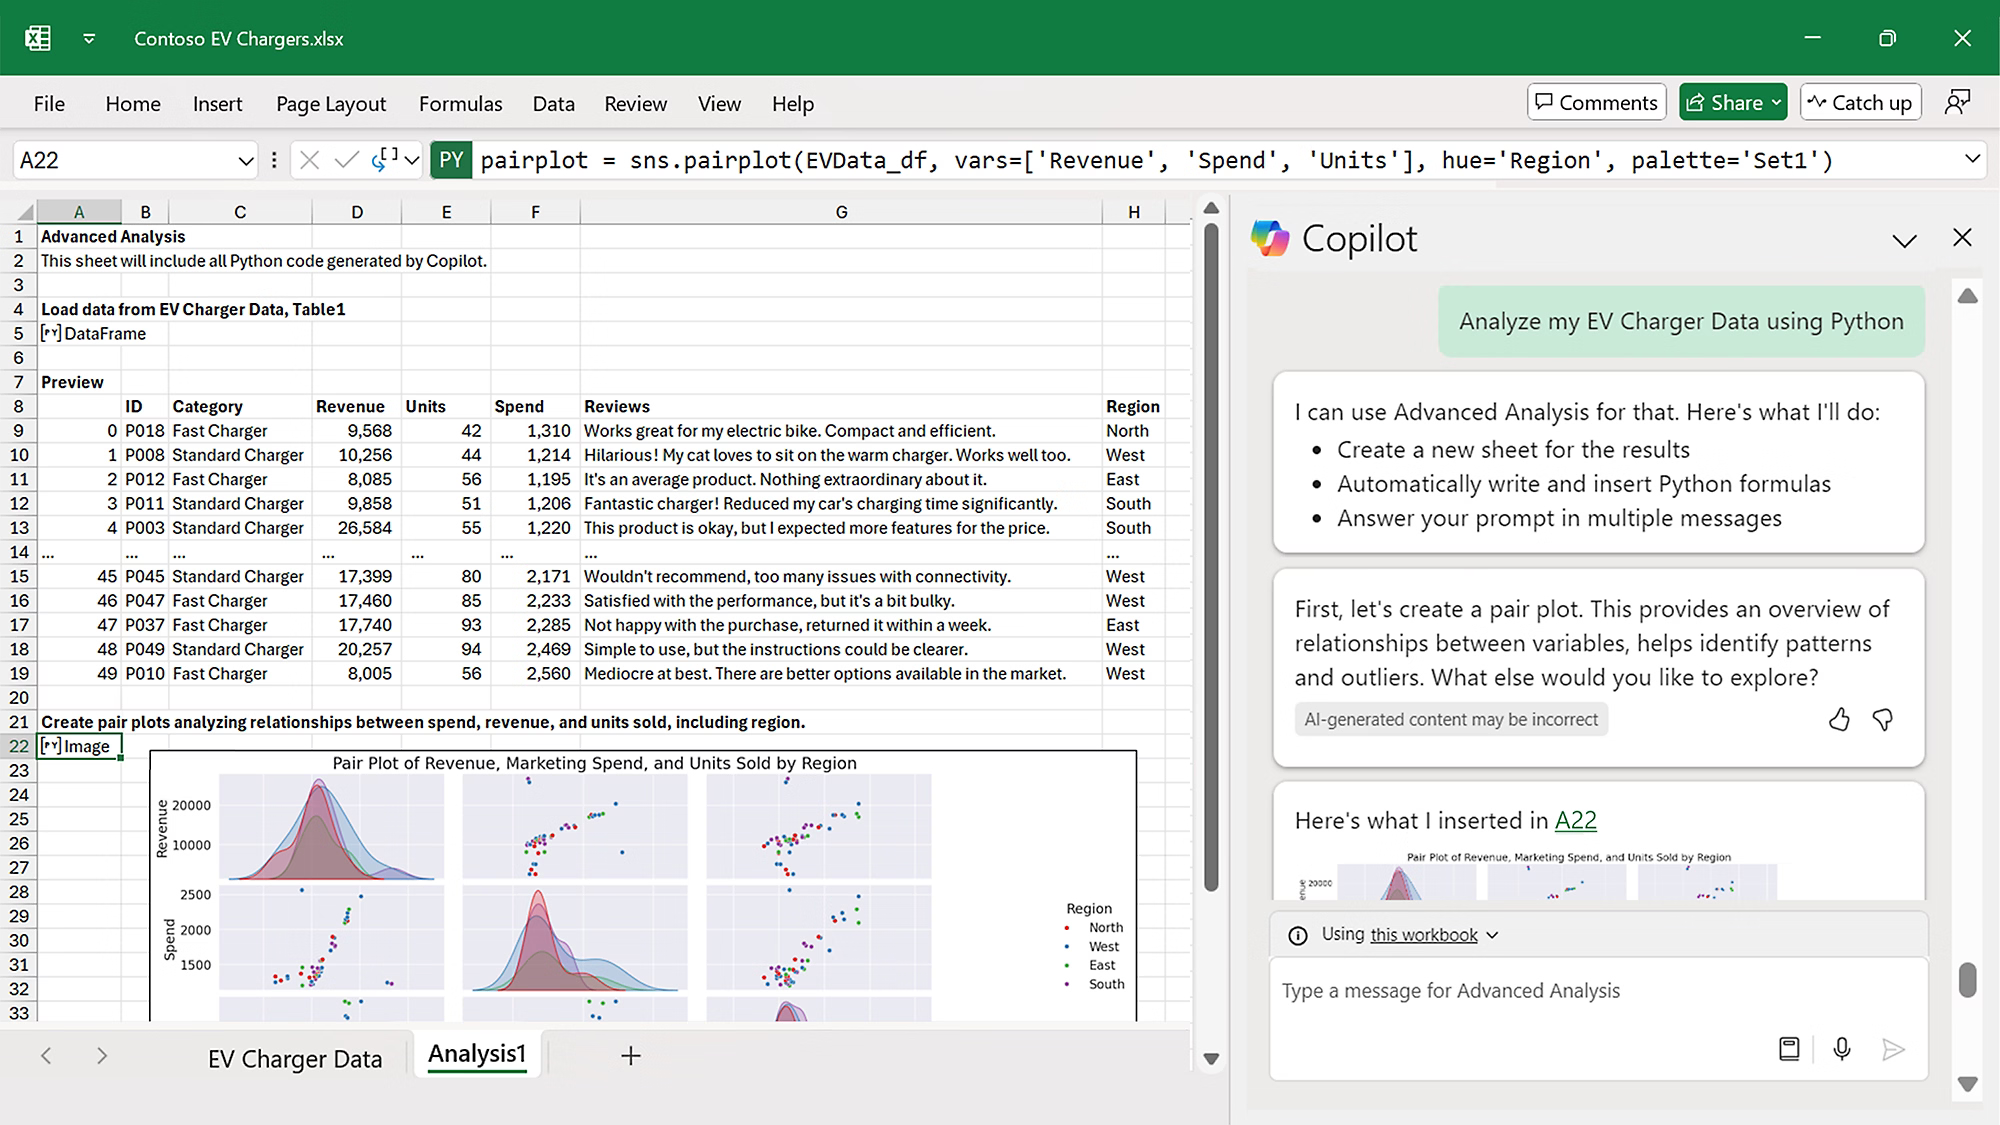
Some, like Microsoft Excel and Google Sheets, have gained natural-language editing capabilities, AI formulae and ad-hoc processing, automatic charting from user prompts, and many more LLM-fused functionalities. Others have been fundamentally reimagined and redesigned around the capabilities AIs provide.
Most of these tools remain the same in their core, only now with simplified operation and new features.
Dashboards
Just a few years ago, dashboards held the title of the best tools for democratizing data.
Dashboards are user-friendly in that they are pre-designed (i.e., users do not have an empty canvas), visual-first, and rely on mouse clicks as the primary interaction method. For the less technically prepared, they have been the best entry point to data insight.
On the other hand, dashboards are limiting. They are usually heavily scoped by the questions their creators had in mind, which may not match what a given consumer is actually trying to find out. And it is often non-trivial or even impossible for an end user to tweak them “just a little.”
But the major downside, as we have learned over time, is that dashboards have been fully reactive. They follow user instructions without regard to (or understanding of) user intent.
However, as consumers got used to less rigid experiences, dashboards had to be adjusted to become more interactive and close this gap.
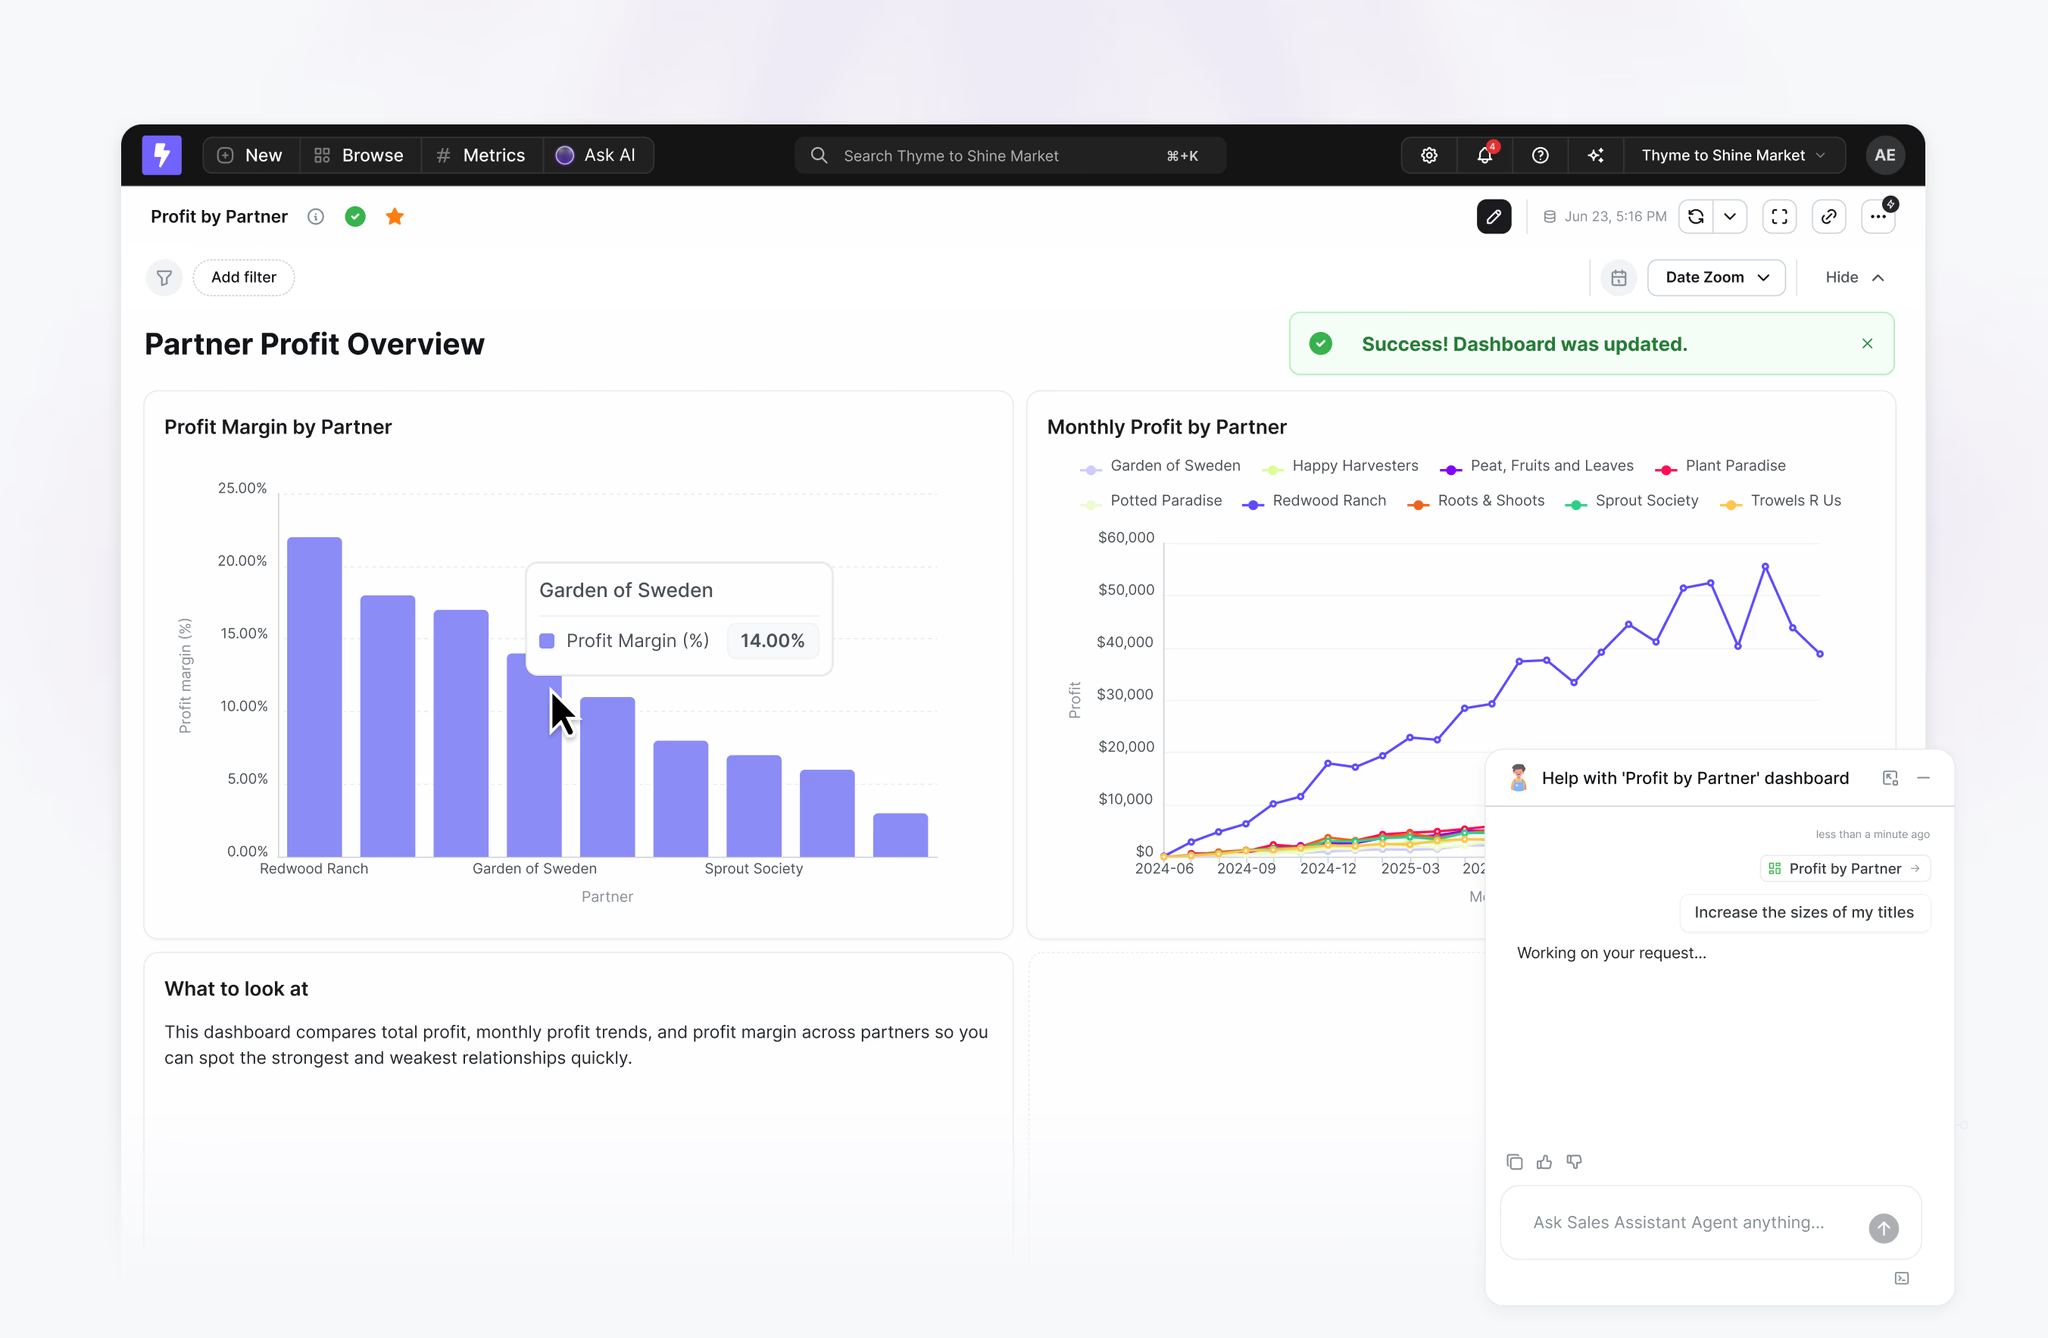
There are several examples, but Lightdash represents this transformation very clearly. From a dashboard (“visual layer for dbt”) built for technically capable analysts, through being a light enabler of self-service analytics, it has become a fully agentic BI tool for self-service users and other (maybe) self-service consumers, like agents.
Conversational analytics/chat agents
These tools were (re)born in the AI era. Built from the ground up as LLM-backed and chat-first, they provide a more vague control plane for the user compared to dashboards. On the other hand, they can be (and most often are) quite proactive.
Chat agents can go beyond specific instructions and work towards understanding and acting on user intent. Although they often start from a clean slate at the beginning, they figure out the best way to present the findings, from a number, through some explanation, to interactive visualizations.
There have been attempts to tackle this category for a long time. But it is the AI revolution that has made these efforts really efficient—to the point that the whole market of analytics agents is blooming now.
The promise is the simplicity of the UI, especially in answering ad hoc, less strictly defined questions. When I don’t know exactly what I want, and I don’t have the bandwidth and energy to find it out, but I still need an answer. Just an answer, no fuss. Rigorous analysts can argue against it as much as they want; it is very often the reality of our time.
One example is Databricks AI/BI Genie, which was a major hit and is becoming a stronger and more powerful self-service analytics tool by the day. Not only on its own account but also as part of a larger ecosystem (agents preprocess more signals within Databricks that it can use, more capable LLMs are launched, etc.).
But obviously there are lots of other excellent products as well. ThoughtSpot (a long-term champion in this category) has Spotter, Snowflake has Cortex Analyst, Sigma has its Assistant, and Power BI is increasingly pushing Copilot in this direction, just to name a few.
Not surprisingly, AI providers have also started moving into this niche. OpenAI recently introduced its Data agent so that similar data analyses can be done directly from within the ChatGPT interface.
The implementations differ, but the basic bet is the same: let users ask data a question instead of first figuring out how to operate the analytics tool.
Agentic and data apps
Agentic and data applications have been emerging really fast at the focal point of a few recent trends:
- With LLM-based coding tools and methodologies, custom application development is often on par with dashboards in speed and effort. But apps can be more tailored.
- With the convergence of transactional and analytical data storage and faster processing, interactive data apps are well within the viable zone as well. Several mixed transactional/analytic workflows can now be served.
- Many of the data apps for self-service analytics are lightweight and rather small compared to the more traditional enterprise applications. Thus, it is more feasible for business functions to specify, procure, and operate them.
- Data platform providers have an appetite for application workloads as well. There used to be a notion that data goes to compute, but for a while data attracts and anchors compute more than the other way around.
- LLMs can be quite naturally and quickly integrated into custom applications, thus a modern user experience is easy to achieve.
- LLMs have created practical access to unstructured data, especially documents, that used to be mostly out of reach for reasonably scoped initiatives before. There are lots of these, and many valuable use cases can be built on them.
We see a proliferation of data applications on the market. Unsurprisingly, platforms have been urged to provide practical tools. Databricks has Databricks Apps, and Snowflake has its own Native Apps (on similar open technology grounds), heavily integrated into their respective platforms.
Personal agents
As much as agents can be great for organizational use cases, they can also be useful engines for solving local, individual data analytics challenges. They may summarize long email threads, automatically notify on Slack about data constellations of personal interest, or dig into and verbalize the background of unexpected variations in a report.
Packaging natural language processing functionality into a personal productivity tool used to be an extremely niche playground for professionals at the crossroads of multiple rather advanced topics, from NLP, through data analytics, software engineering, and infrastructure maintenance.
It has fundamentally changed with the advent of LLMs (and their simple APIs), and especially with the introduction of modern, average-user-friendly interfaces for building agents.
One of the more hyped, early ones was n8n (still ticking fine). Now you can find an agent builder on all major platforms, from Databricks Agent Bricks (and the toolset around it), to Snowflake Cortex Agent, Microsoft Copilot Studio, or Google Agent Designer.
Beyond n8n, there are other open-source/self-hostable alternatives, such as Langflow and Flowise. At the moment, most larger organizations tend to pick the platform-integrated options.
One-stop shop platforms for self-service analytics
As self-service analytics gets more and more within the reach of non-technical users, some vendors start offering very trimmed-down UIs to serve them. This provides users with a simple way to “just get an answer,” without having to understand the mechanics behind it.
Among the large platforms, Databricks has made the most visible move with the introduction of Genie One earlier this year. Genie One makes conversational analytics and dashboards available in a customizable but intentionally simple portal.
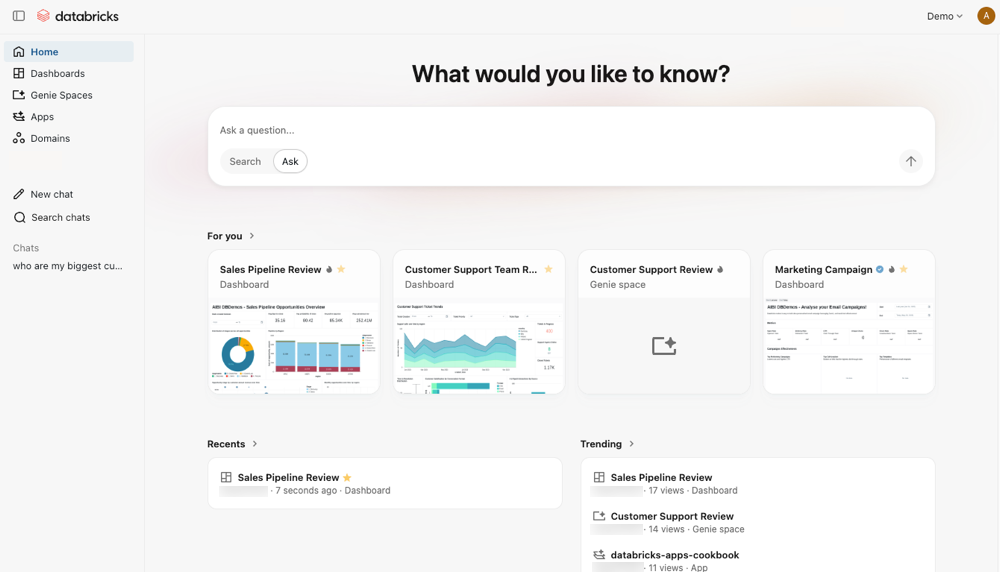
It is more than dashboards, and more than dashboards with “talk-to-your-data” interfaces. It is a true portal into the analytics capabilities of a platform.
For it to be successful, the provider needs to have a variety of tools, deep integration into the metadata layer, and a vision for effective simplification.
This UI form has been a smash hit with users, and now the whole industry is converging toward this architecture.
In the background, engineers are putting in tremendous effort to overcome the technological and analytical challenges behind this simplicity.
Responses and analytics have to be meaningful, correct, and trustworthy, while operating on minimal question context. All these systems have to build the reply based on what they could learn about the data and the user earlier (i.e., metadata) and rely on the LLMs’ reasoning and generation capability.
Afterthought
Obviously, self-service analytics tools can’t solve all the problems, especially not overnight. For example, data collection, ingestion, and integration remain beyond their scope.
However, modern metadata management and a shift in user interaction patterns have made great strides towards more realistic self-service analytics, which is a huge part of data democratization.
Metadata is the foundational piece: it guides and anchors every modern data analytics. Through new tools, metadata is getting richer, and it is becoming more graph-oriented. Its collection and organization are getting more automated, and systems are starting to learn metadata from usage as well.
UIs are getting more intelligent with the addition of conversational analytics everywhere. And there is a definite trend towards simplification of user-facing functionalities—at the expense of much more complex data processing behind the scenes.