TL;DR
- Unified logging allows you to wire every app, serving endpoint, and workflow to the same OTel telemetry plane: logs, spans, gateway calls, and metrics.
- Unity AI Gateway routes all LLM calls and tags every request. This is how you make per-user, per-app, per-team spend trackable and get complete Databricks Apps cost attribution.
- Build one bronze → silver → gold data model and get fleet-wide SLO visibility with an AI/BI Dashboard and a companion Genie Space for Q&A.
- Close the loop with automated alerts: availability drops, p95 spikes, cost anomalies, quality regressions, and access breaches.
- Find the full setup for fleet monitoring, application insights, cost tracking, and AI code in the repo: databricks-apps-monitor.
Why you need unified logging and cost tracking
Hundreds of Databricks applications are being created across orgs right now. Teams ship fast: a prototype in hours, a single use case app in days, a flagship application in weeks. But without a shared observability layer and controls, things can go very wrong and very expensive, just as fast.
When the marginal cost of an app drops that low, the same engineering effort either piles up shadow IT (apps on personal accounts, untagged, untraced, hand-pushed to prod) or ships production-ready by default. Just like trains move faster on a well-coordinated rail system than on a messy layout of tracks, a growing fleet of apps scales cleaner with the right governance and cost control in place.
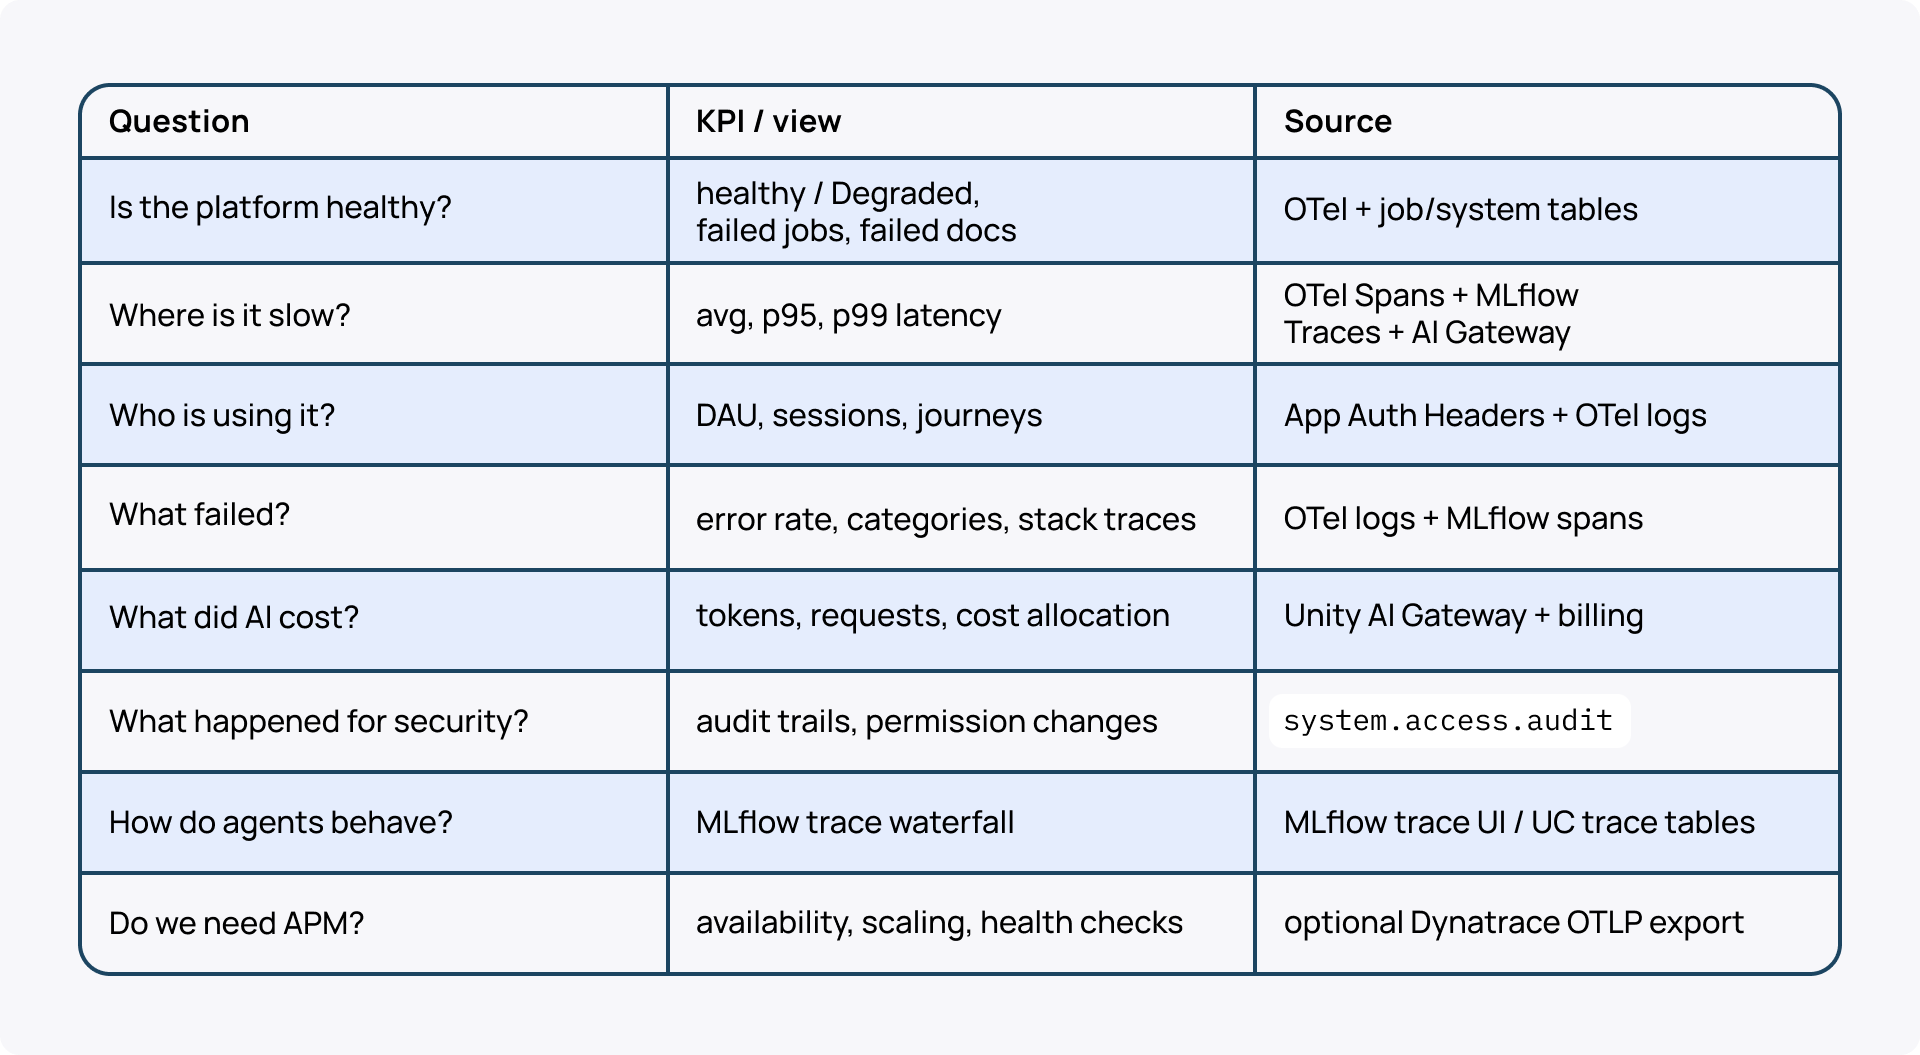
The setup I’m going to share lets you create unified logging, tracing, and cost governance for the fleet of apps you and your teams are building on Databricks. It gives you full traceability and a Databricks-native admin view to answer across every app: Who used it? What happened? What failed? Where was latency? What did it cost?
The whole setup ships as an open reference implementation: databricks-apps-monitor—a monitoring app; the inventory/scan/review/eval/cost jobs; bundle-managed SQL alerts; a Lakeview dashboard; and a five-app demo fleet—deployed with two Declarative Automation Bundles. Here’s a quick video tour; the screenshots below are from this deployment.
The setup provides
- Operational command center with full traceability and auditing
- Cost attribution and FinOps guardrails
- SLO health, uptime, latency, and errors monitoring
- Correlation-ID / traceparent context
- Unified logs, traces, and metrics
- Incident alerting and debuggability
- App, agent, data & pipeline visibility
What you can see across every app
- Service health: Authenticated reachability probes and status per app. A stopped app's URL still answers HTTP 200 with a placeholder page, and the platform proxy intercepts /healthz, so probe real routes and check response content, not status codes.
- Performance (OTel): p95/p99 latency, HTTP errors, and stack traces.
- Usage stats: DAU, session journeys, and version adoption.
- Access control: Audit trails for logins and permission changes.
- Cost allocation: AI spend split by agent, team, and cost center.
- Agent quality: Relevance, faithfulness, and toxicity eval scores.
- Data health: Freshness, null rates, and expectation failures.
- Security: Nightly dependency audits and vulnerability scans.
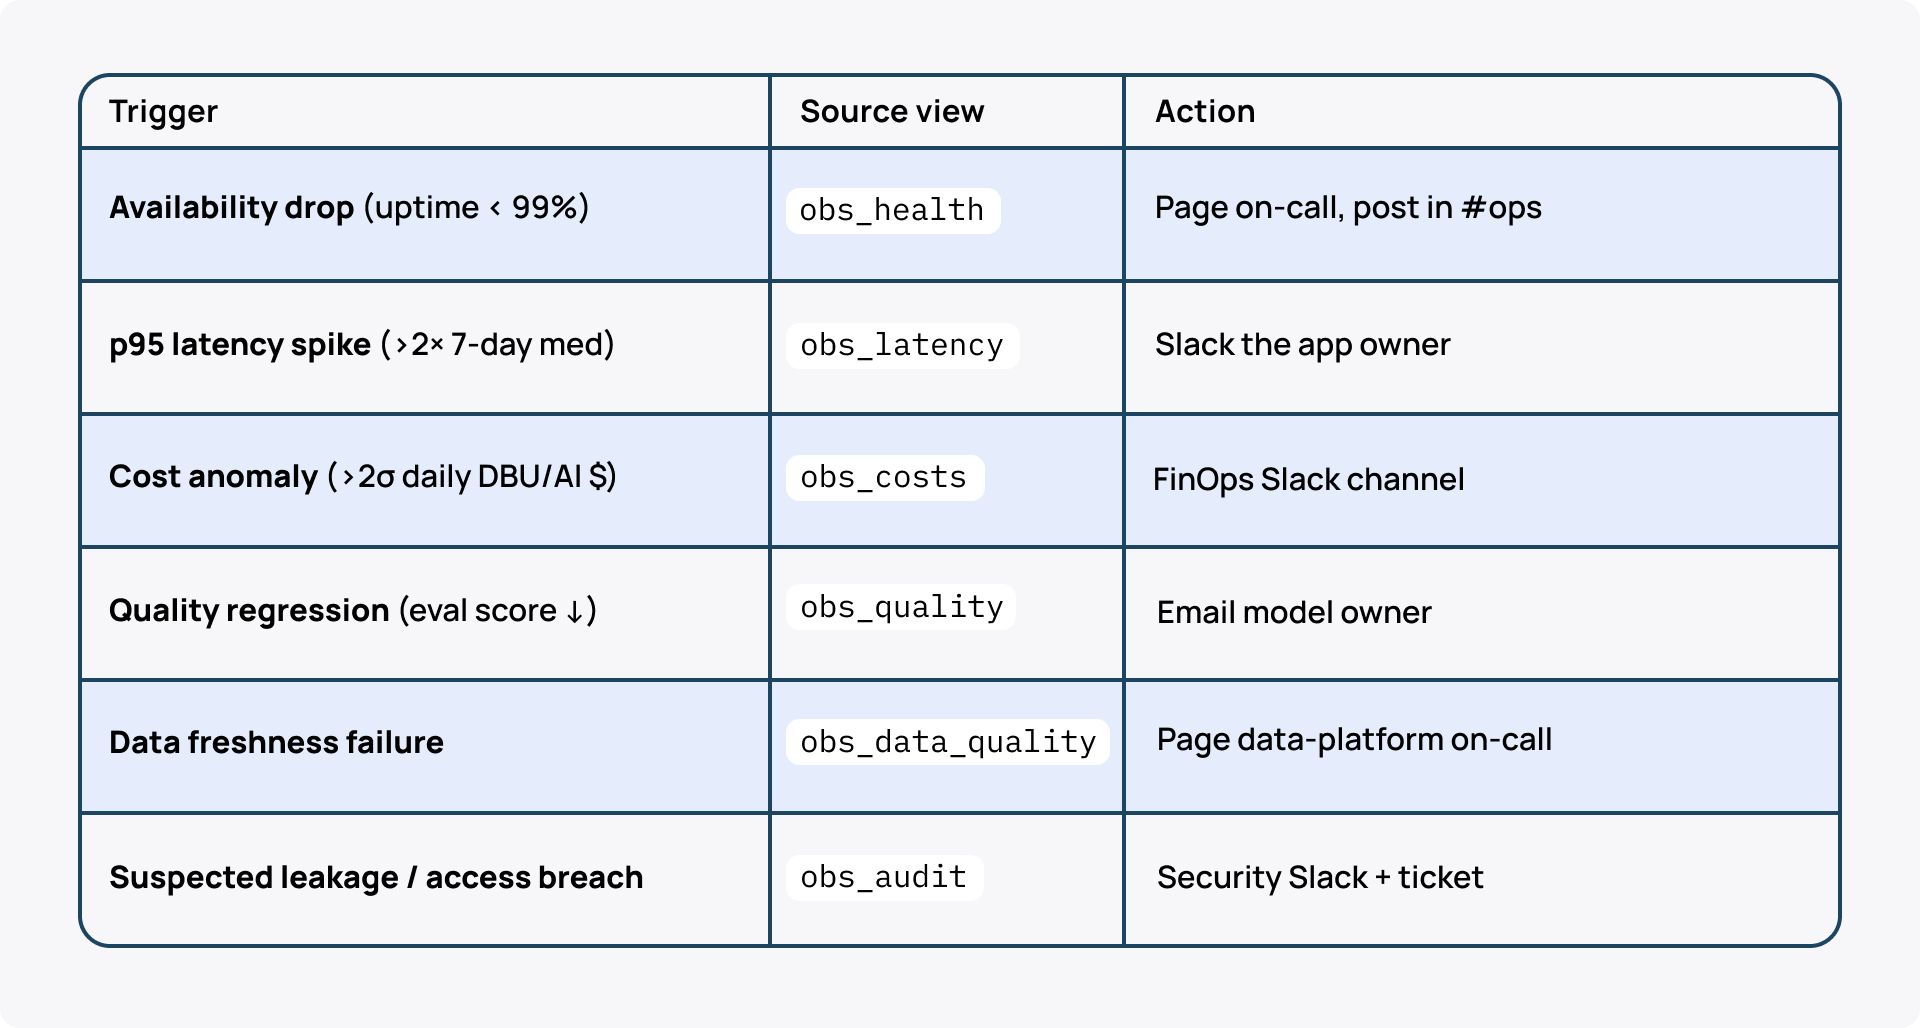
Alerting thresholds you can set up
- Availability drops: Uptime < 99% triggers immediate on-call pages.
- Latency spikes: p95 shifts >2x over 7-day medians alert app owners.
- Cost anomalies: Daily spend exceeding 2σ triggers FinOps alerts.
- Quality regressions: Significant drops in model evaluation scores.
- Data failures: Freshness or DQ check failures in upstream pipelines.
- Access breaches: Suspected leakage or unauthorized permission changes.
How to set up unified logging for Databricks Apps
This layer serves the deep-dive journey, answering the key questions a developer or support engineer has: What exactly happened? Where was the latency?
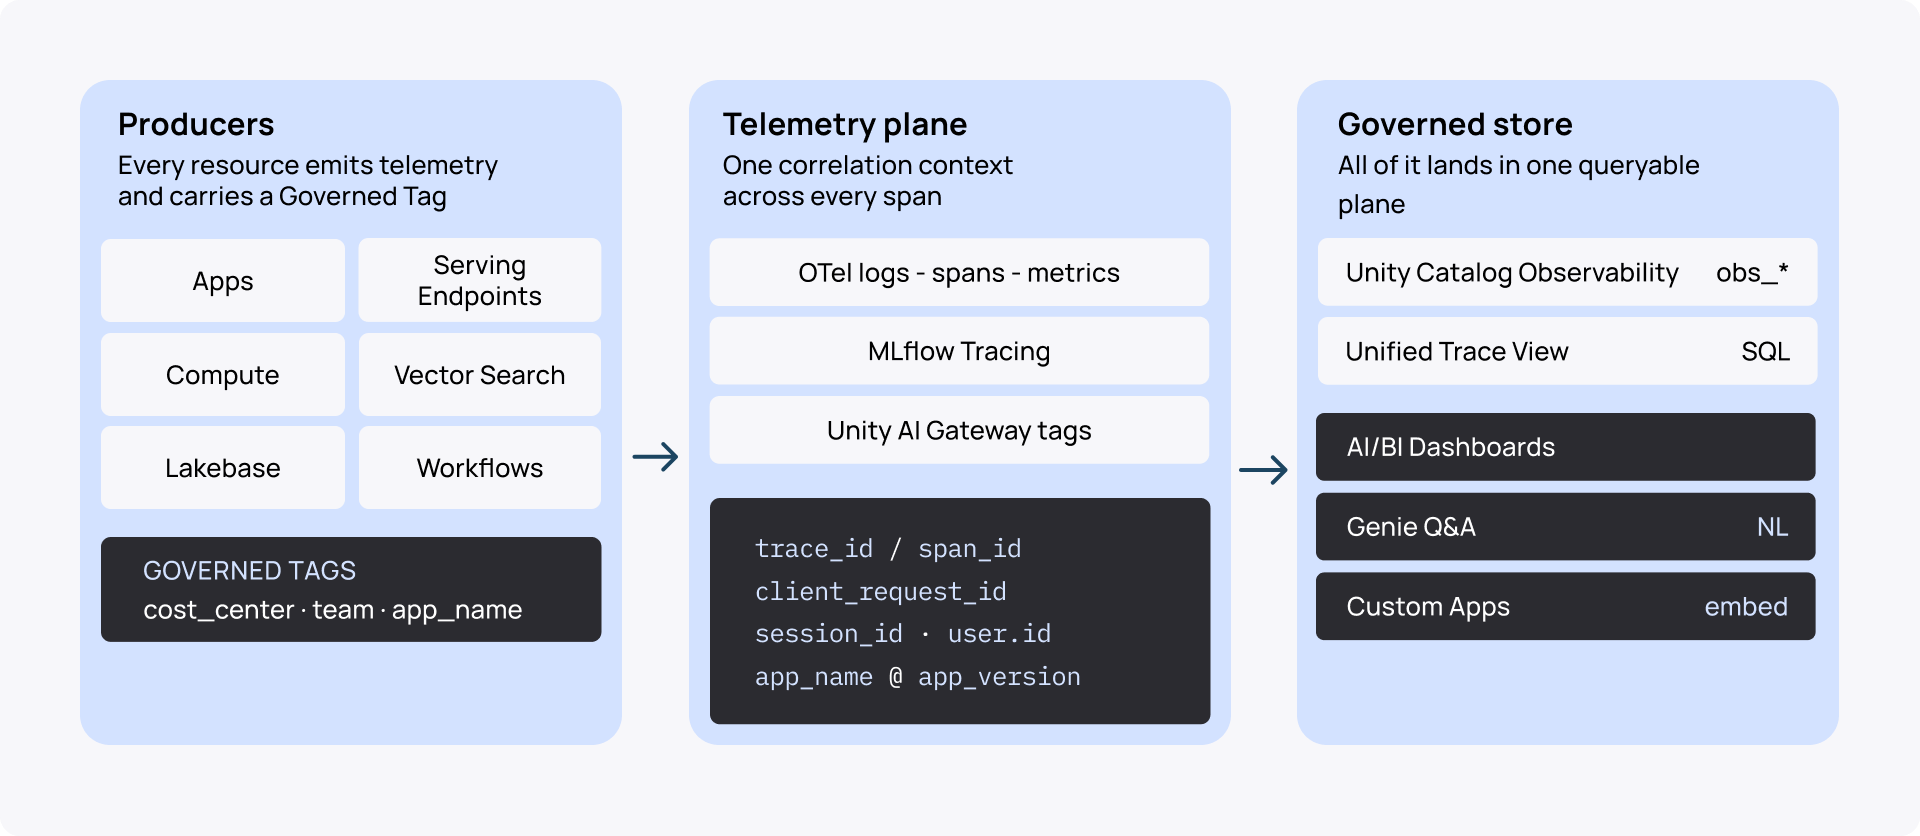
Every producer in the ecosystem emits telemetry and carries a Governed Tag. This makes it possible to trace a complete user request from the frontend through every agent action, model call, and pipeline job, landing in a governed Unity Catalog observability schema.
3 technologies that make this work
Databricks Apps telemetry
A sidecar OTel collector is injected into every replica. The app spec carries telemetry_export_destinations and ships OTLP/gRPC (localhost:4317) via Zerobus into three Unity Catalog Delta tables. The runtime injects the collector endpoint (OTEL_EXPORTER_OTLP_ENDPOINT) into every container—never pin it manually; a hard-coded endpoint silently kills span export.
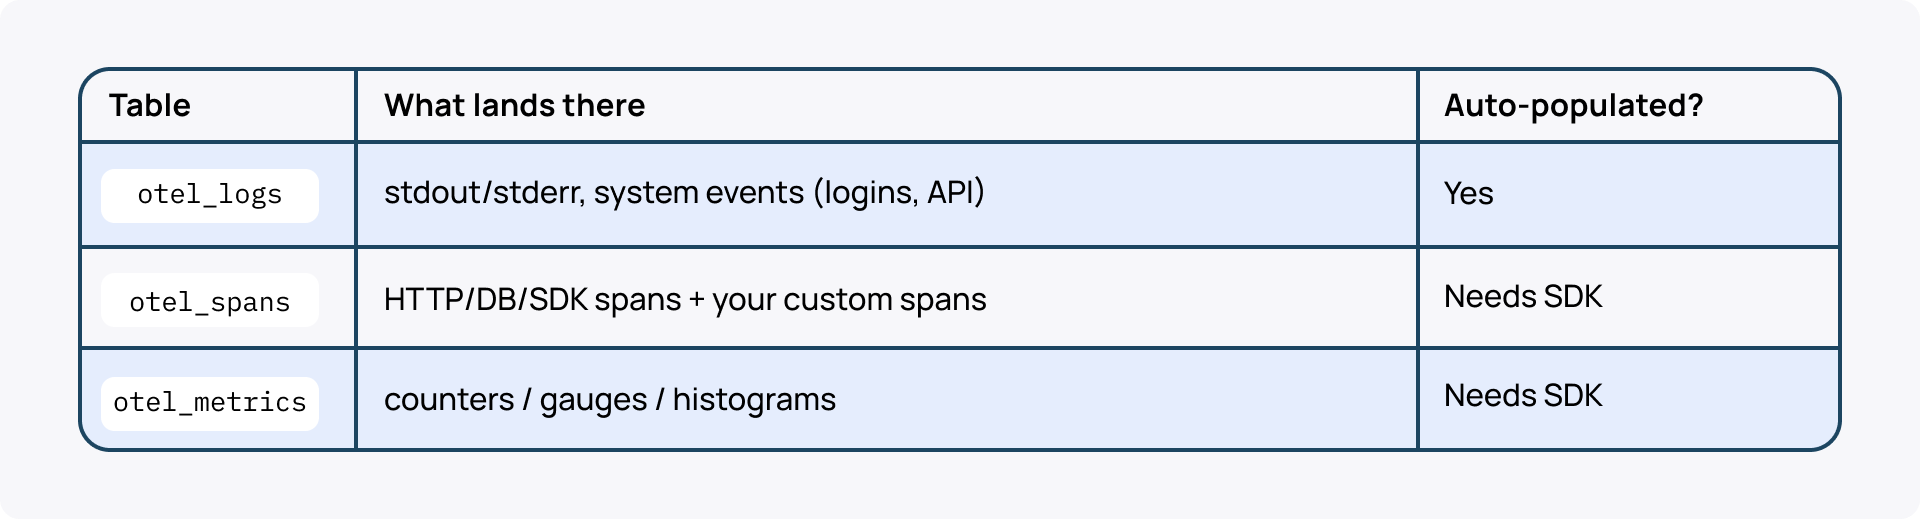
Correlation columns the rest of the world joins on: time, service_name, trace_id, span_id, attributes.
OpenTelemetry (OTel)
Standard for logs + spans + metrics with shared TraceId/SpanId. In Databricks Apps:
- Zero-code via opentelemetry-instrument in app.yaml—auto-traces FastAPI, requests, SQLAlchemy.
- Custom spans for business logic, syscalls, adapters.
- Semantic conventions for user.id, session.id, gen_ai.request.model.
command: [opentelemetry-instrument, uvicorn, app:app]
MLflow Tracing
GenAI layer on top of OTel—typed span kinds (LLM / RETRIEVER / TOOL / AGENT), prompts, tokens, eval pipeline, trace UI. Stored in an MLflow experiment, optionally bound to UC trace storage (Public Preview) which exposes a {prefix}_trace_unified SQL view.
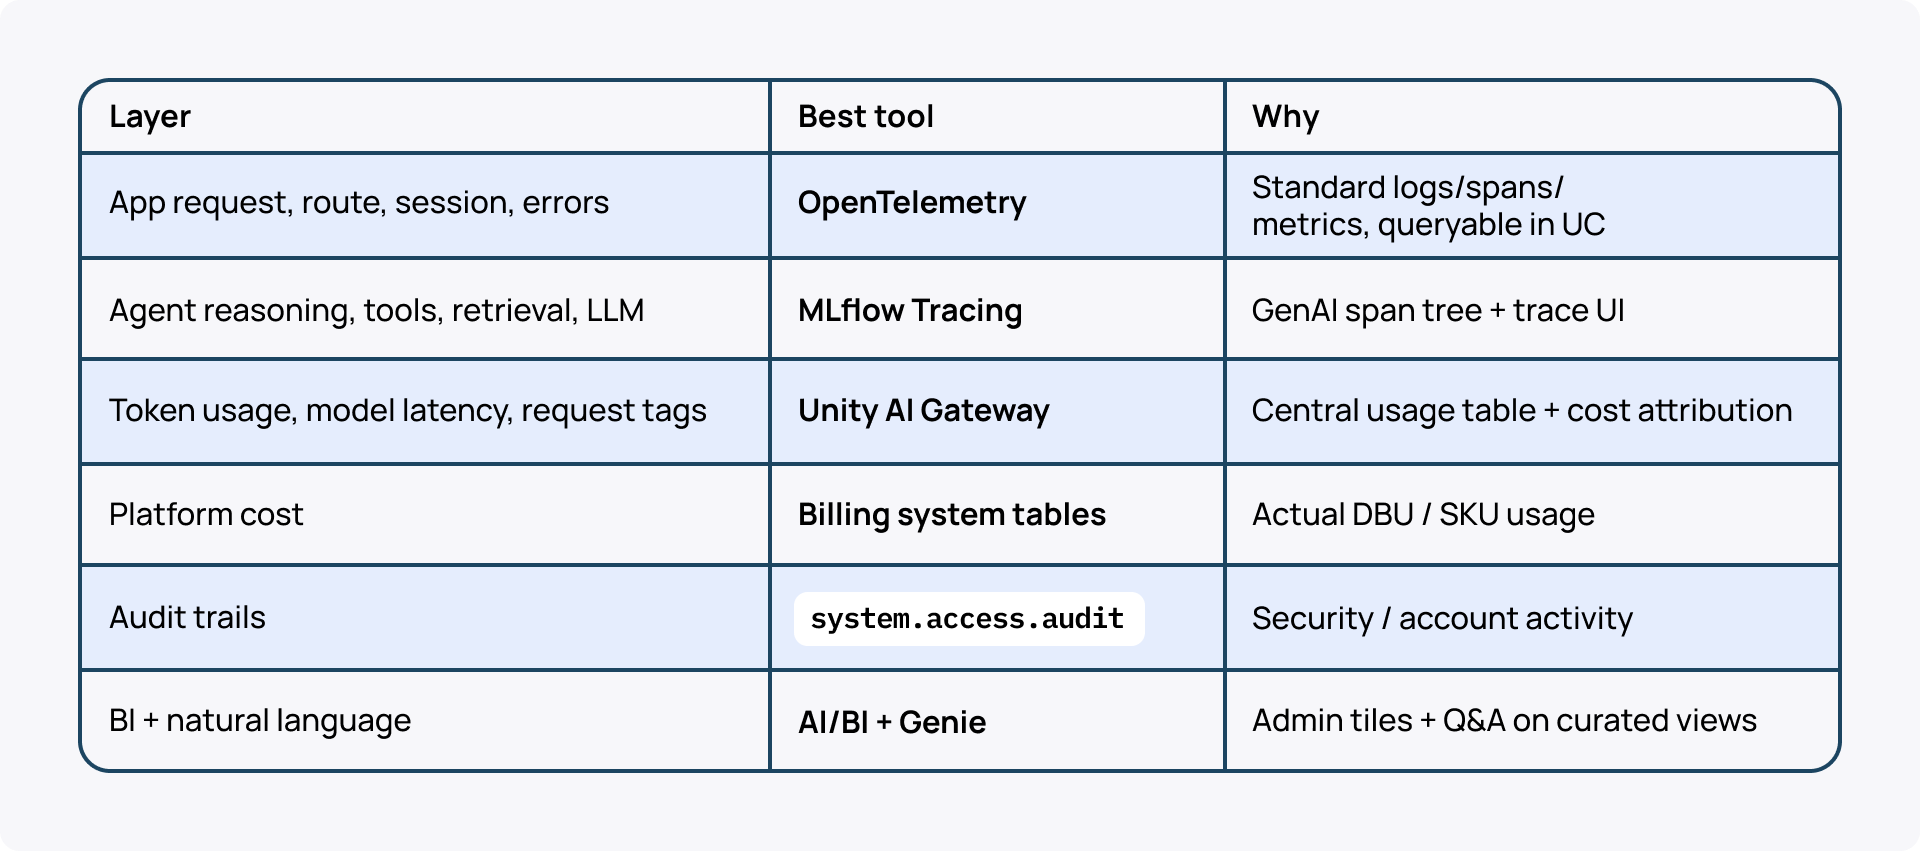
Unity AI Gateway, announced at DAIS 2026, is the new central control plane for all model access: routing, rate limits, policy enforcement, and unified usage tracking via system.ai_gateway.usage. Every LLM call flows through it and gets tagged. This is what makes per-request cost attribution actually work at scale, without building custom infrastructure.
One production caveat: usage rows appear only for endpoints with AI Gateway usage tracking enabled. Pay-per-token Foundation Model API endpoints don't log to system.ai_gateway.usage by default. Send the tags anyway, and keep a baseline you own: stamp gen_ai.* token attributes on your own spans, so exact per-app tokens never depend on the gateway.
Where this fits: compute surfaces
Pick the right surface; instrument all of them the same way.
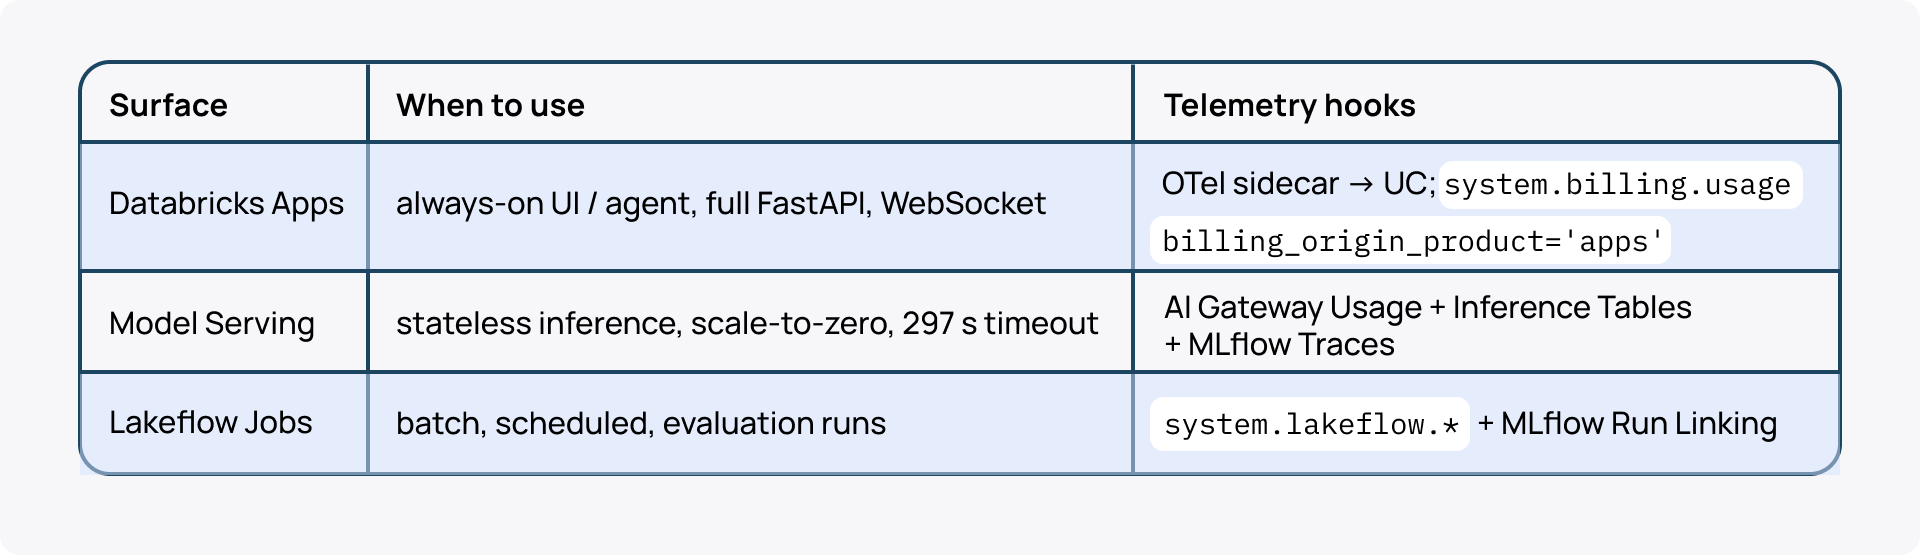
Production typically uses all three: Apps fronts the user, calls Model Serving through AI Gateway, and a nightly Job runs evals and rollups.
For agent apps: AgentServer + ResponsesAgent
AgentServer is the async FastAPI server Databricks ships for agents: /invocations + /responses with built-in tracing. Wrap the agent in ResponsesAgent (MLflow 3.x) for typed schemas, streaming, and auto tool-call capture; mlflow.<framework>.autolog() turns every LLM/tool/retriever call into a typed span.
@invoke()
async def handle(req: ResponsesAgentRequest) -> ResponsesAgentResponse:
   return await run(req)         # traces auto-capture
Architecture for observability graph
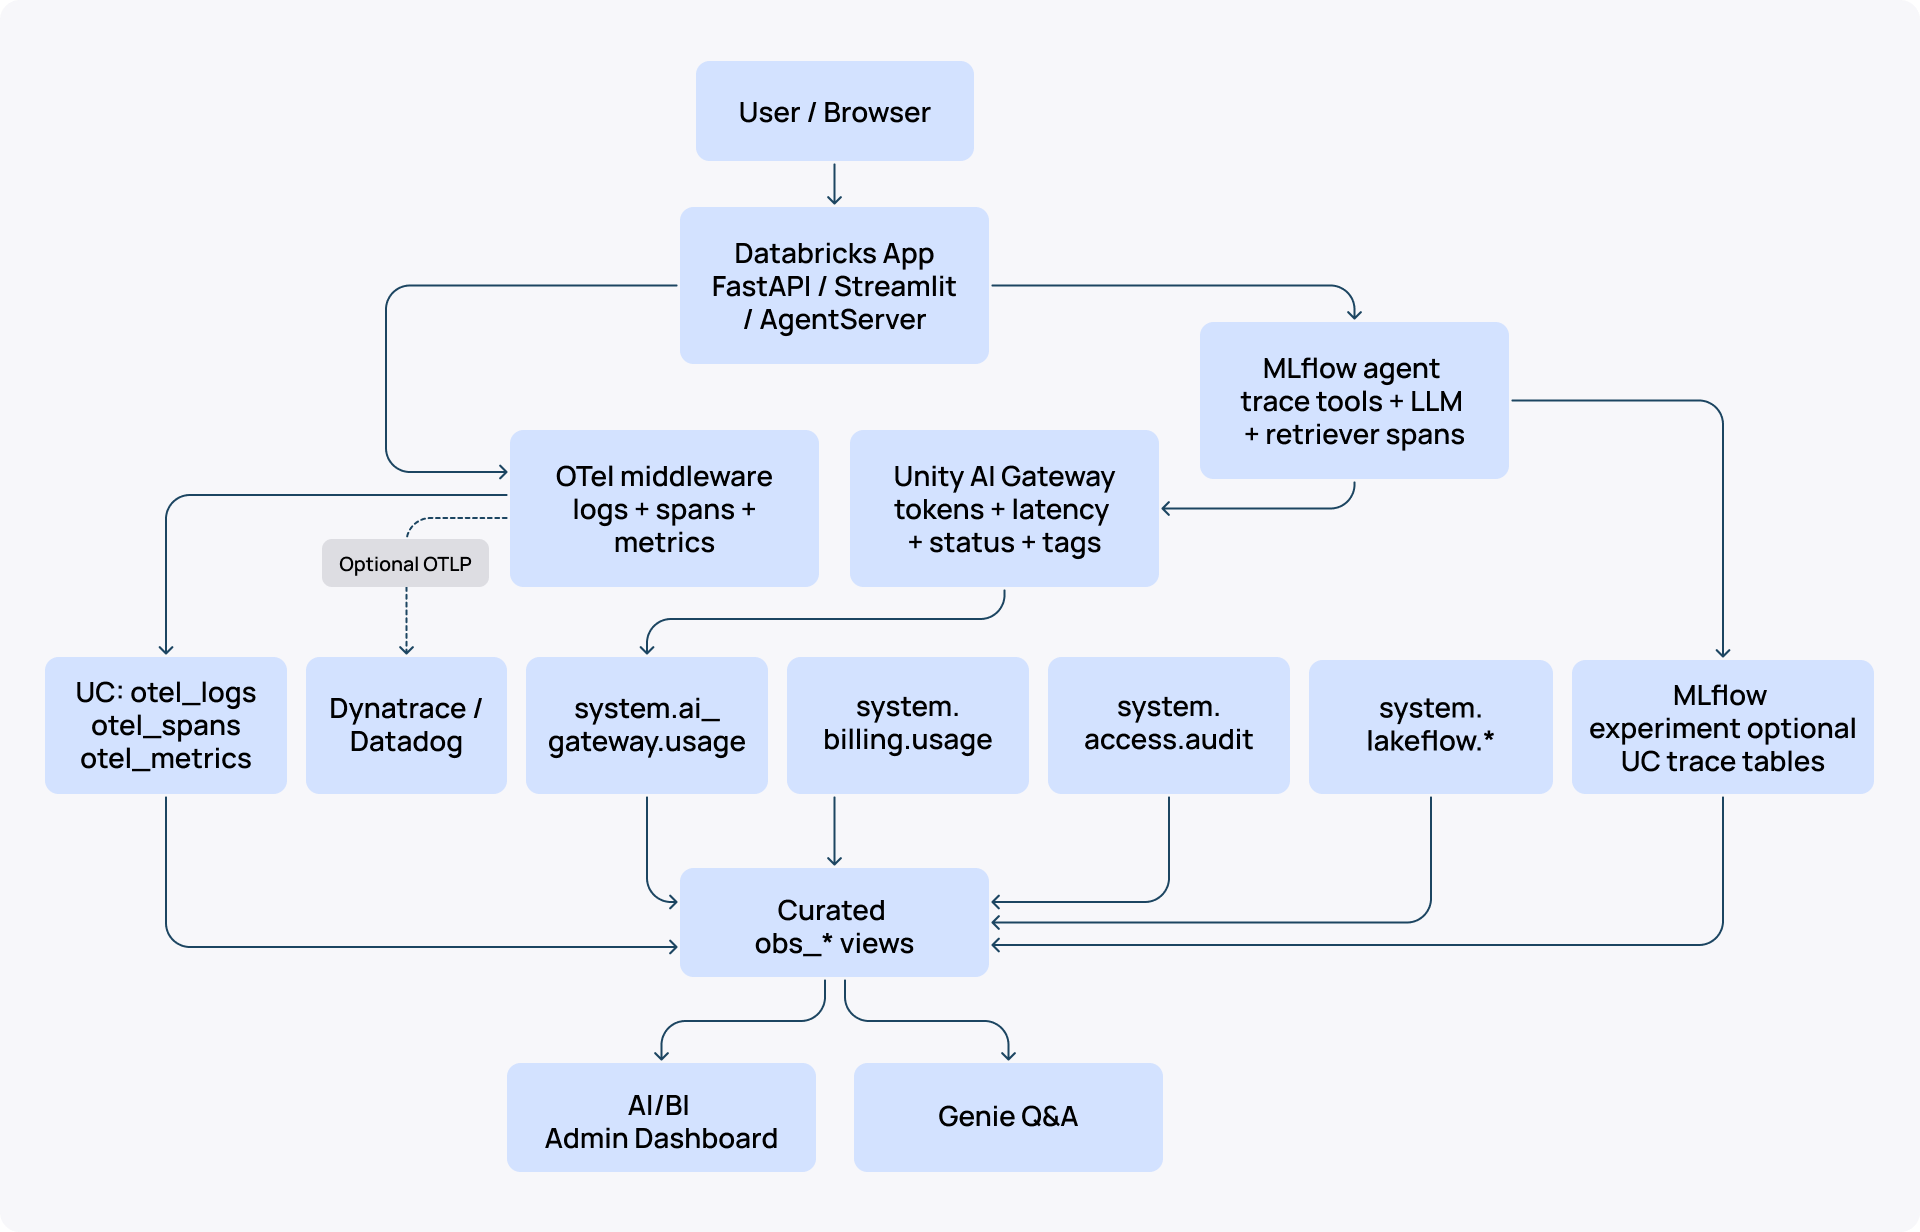
Keep physical data in native places, join through governed Unity Catalog views. Every signal (OTel spans, MLflow agent traces, AI Gateway usage, billing, audit, and pipeline runs) flows into curated obs_* views that power both the AI/BI Dashboard and the Genie Space from a single queryable plane.
The golden envelope
Every log, span, trace, metric, and gateway request must carry the same small set of IDs. Without these, joins across sinks become guesswork.
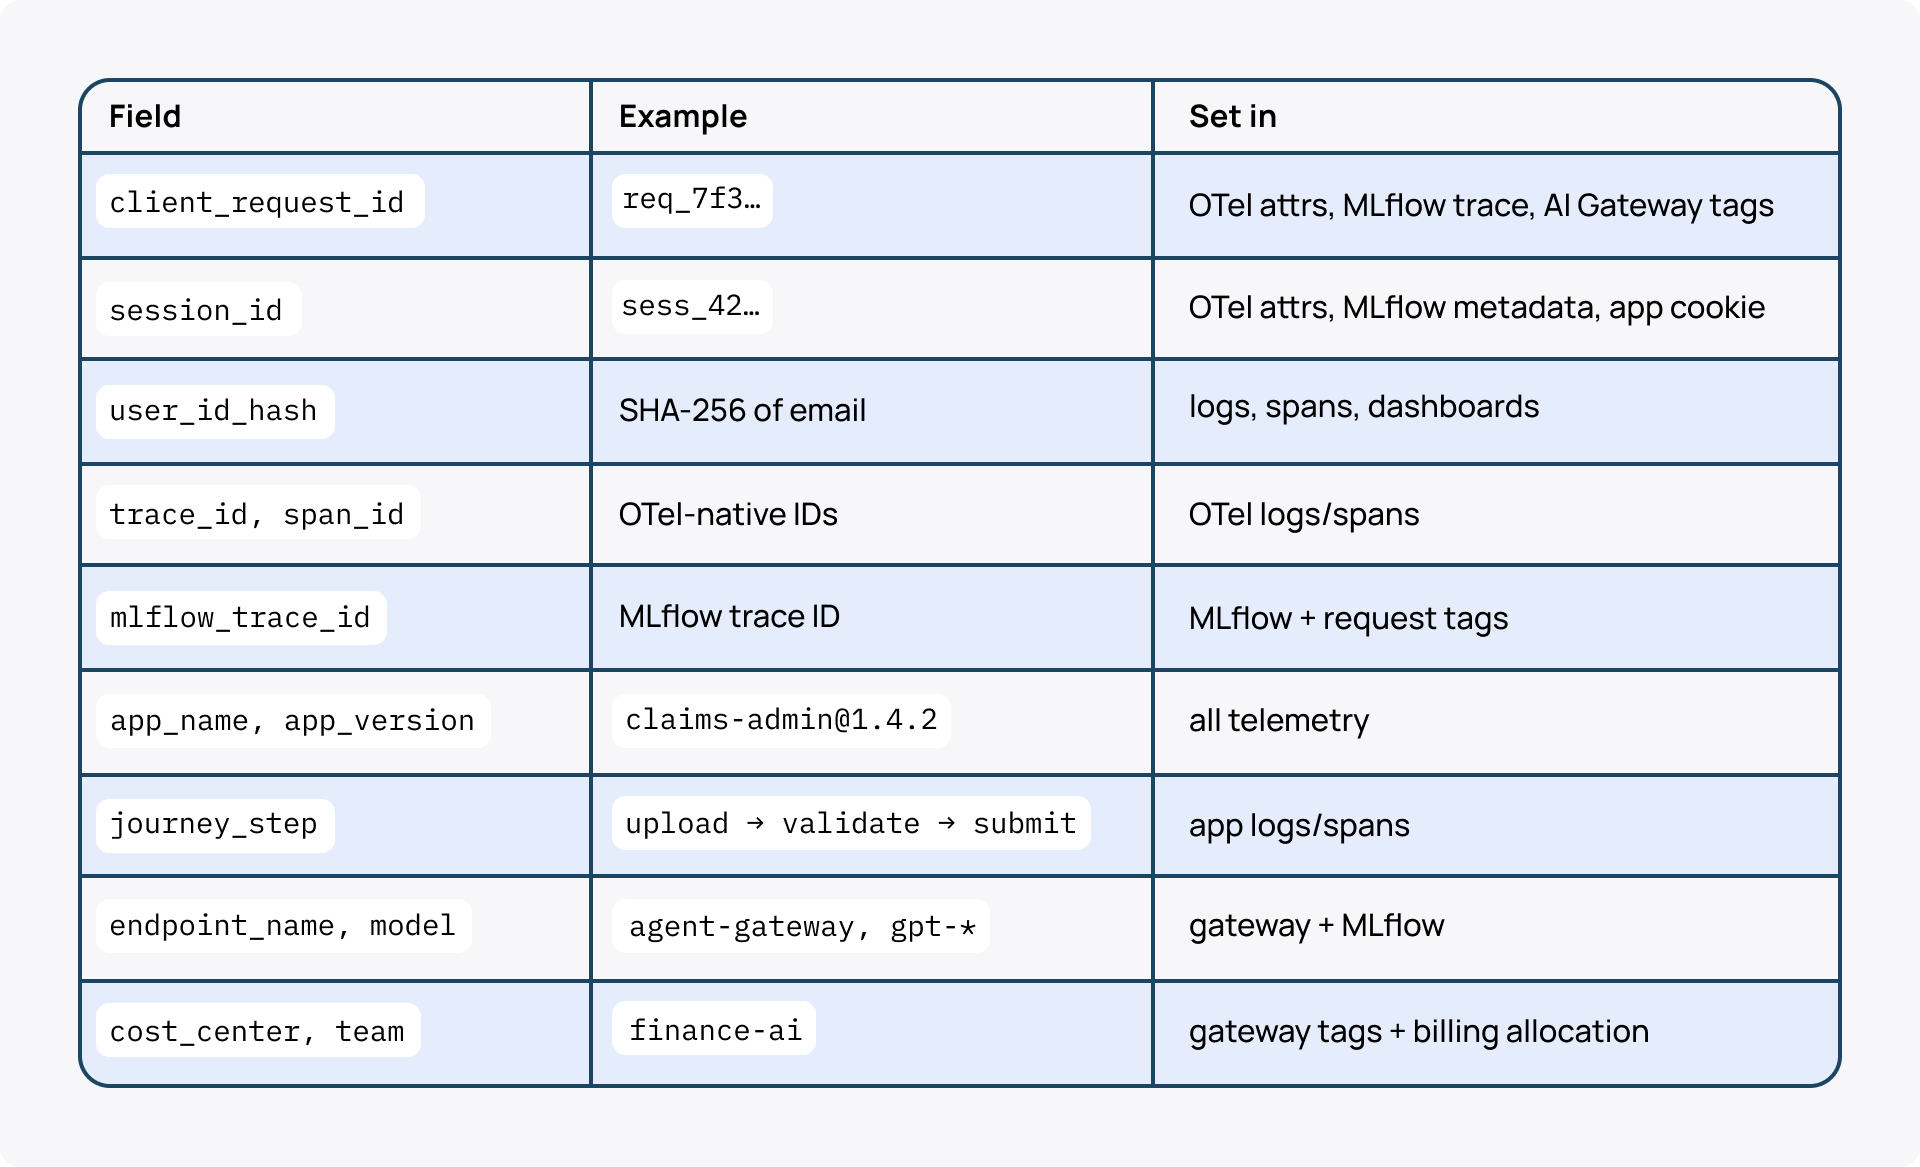
OTel log records carry TraceId/SpanId natively like the linchpin for joining logs to spans. The user comes from the Apps-forwarded X-Forwarded-User header—hash before logging.
What happens in a single chat turn
One user message triggers a chain: request ID stamped, root OTel span opened, MLflow trace enriched, LLM call tagged through AI Gateway. Databricks-Ai-Gateway-Request-Tags acts as the cost-attribution hinge. Every tag echoes into system.ai_gateway.usage.request_tags. Every step lands in Unity Catalog.
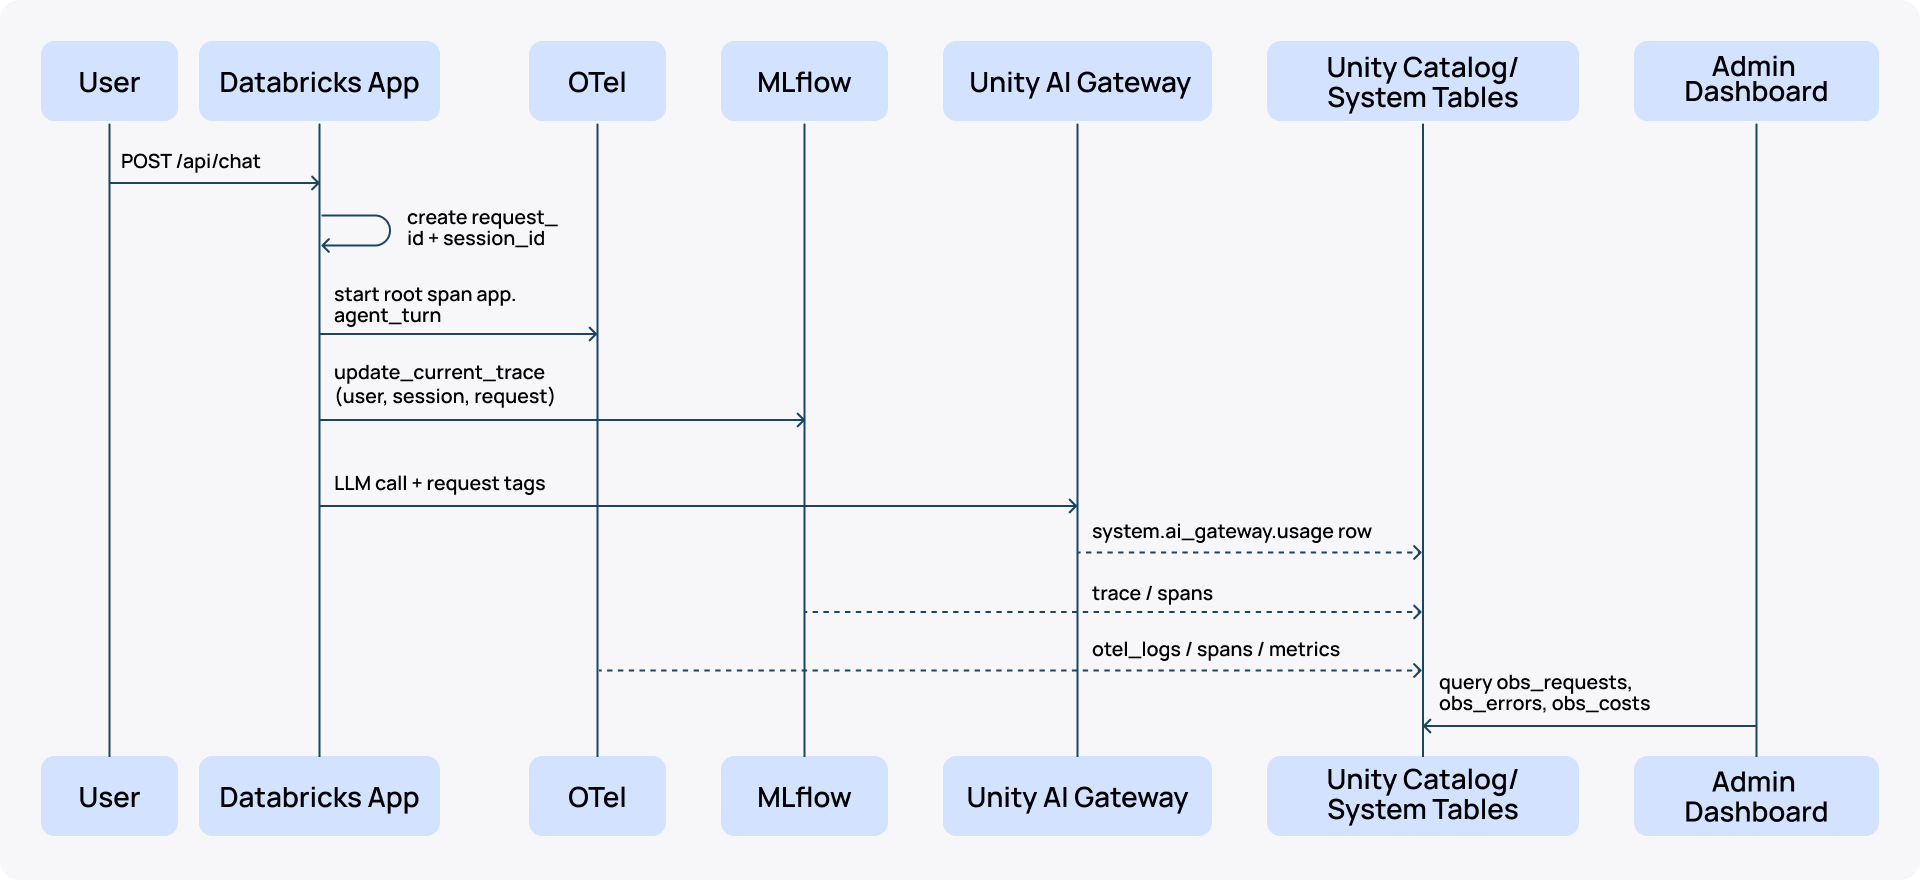
The same turn, as actually captured:
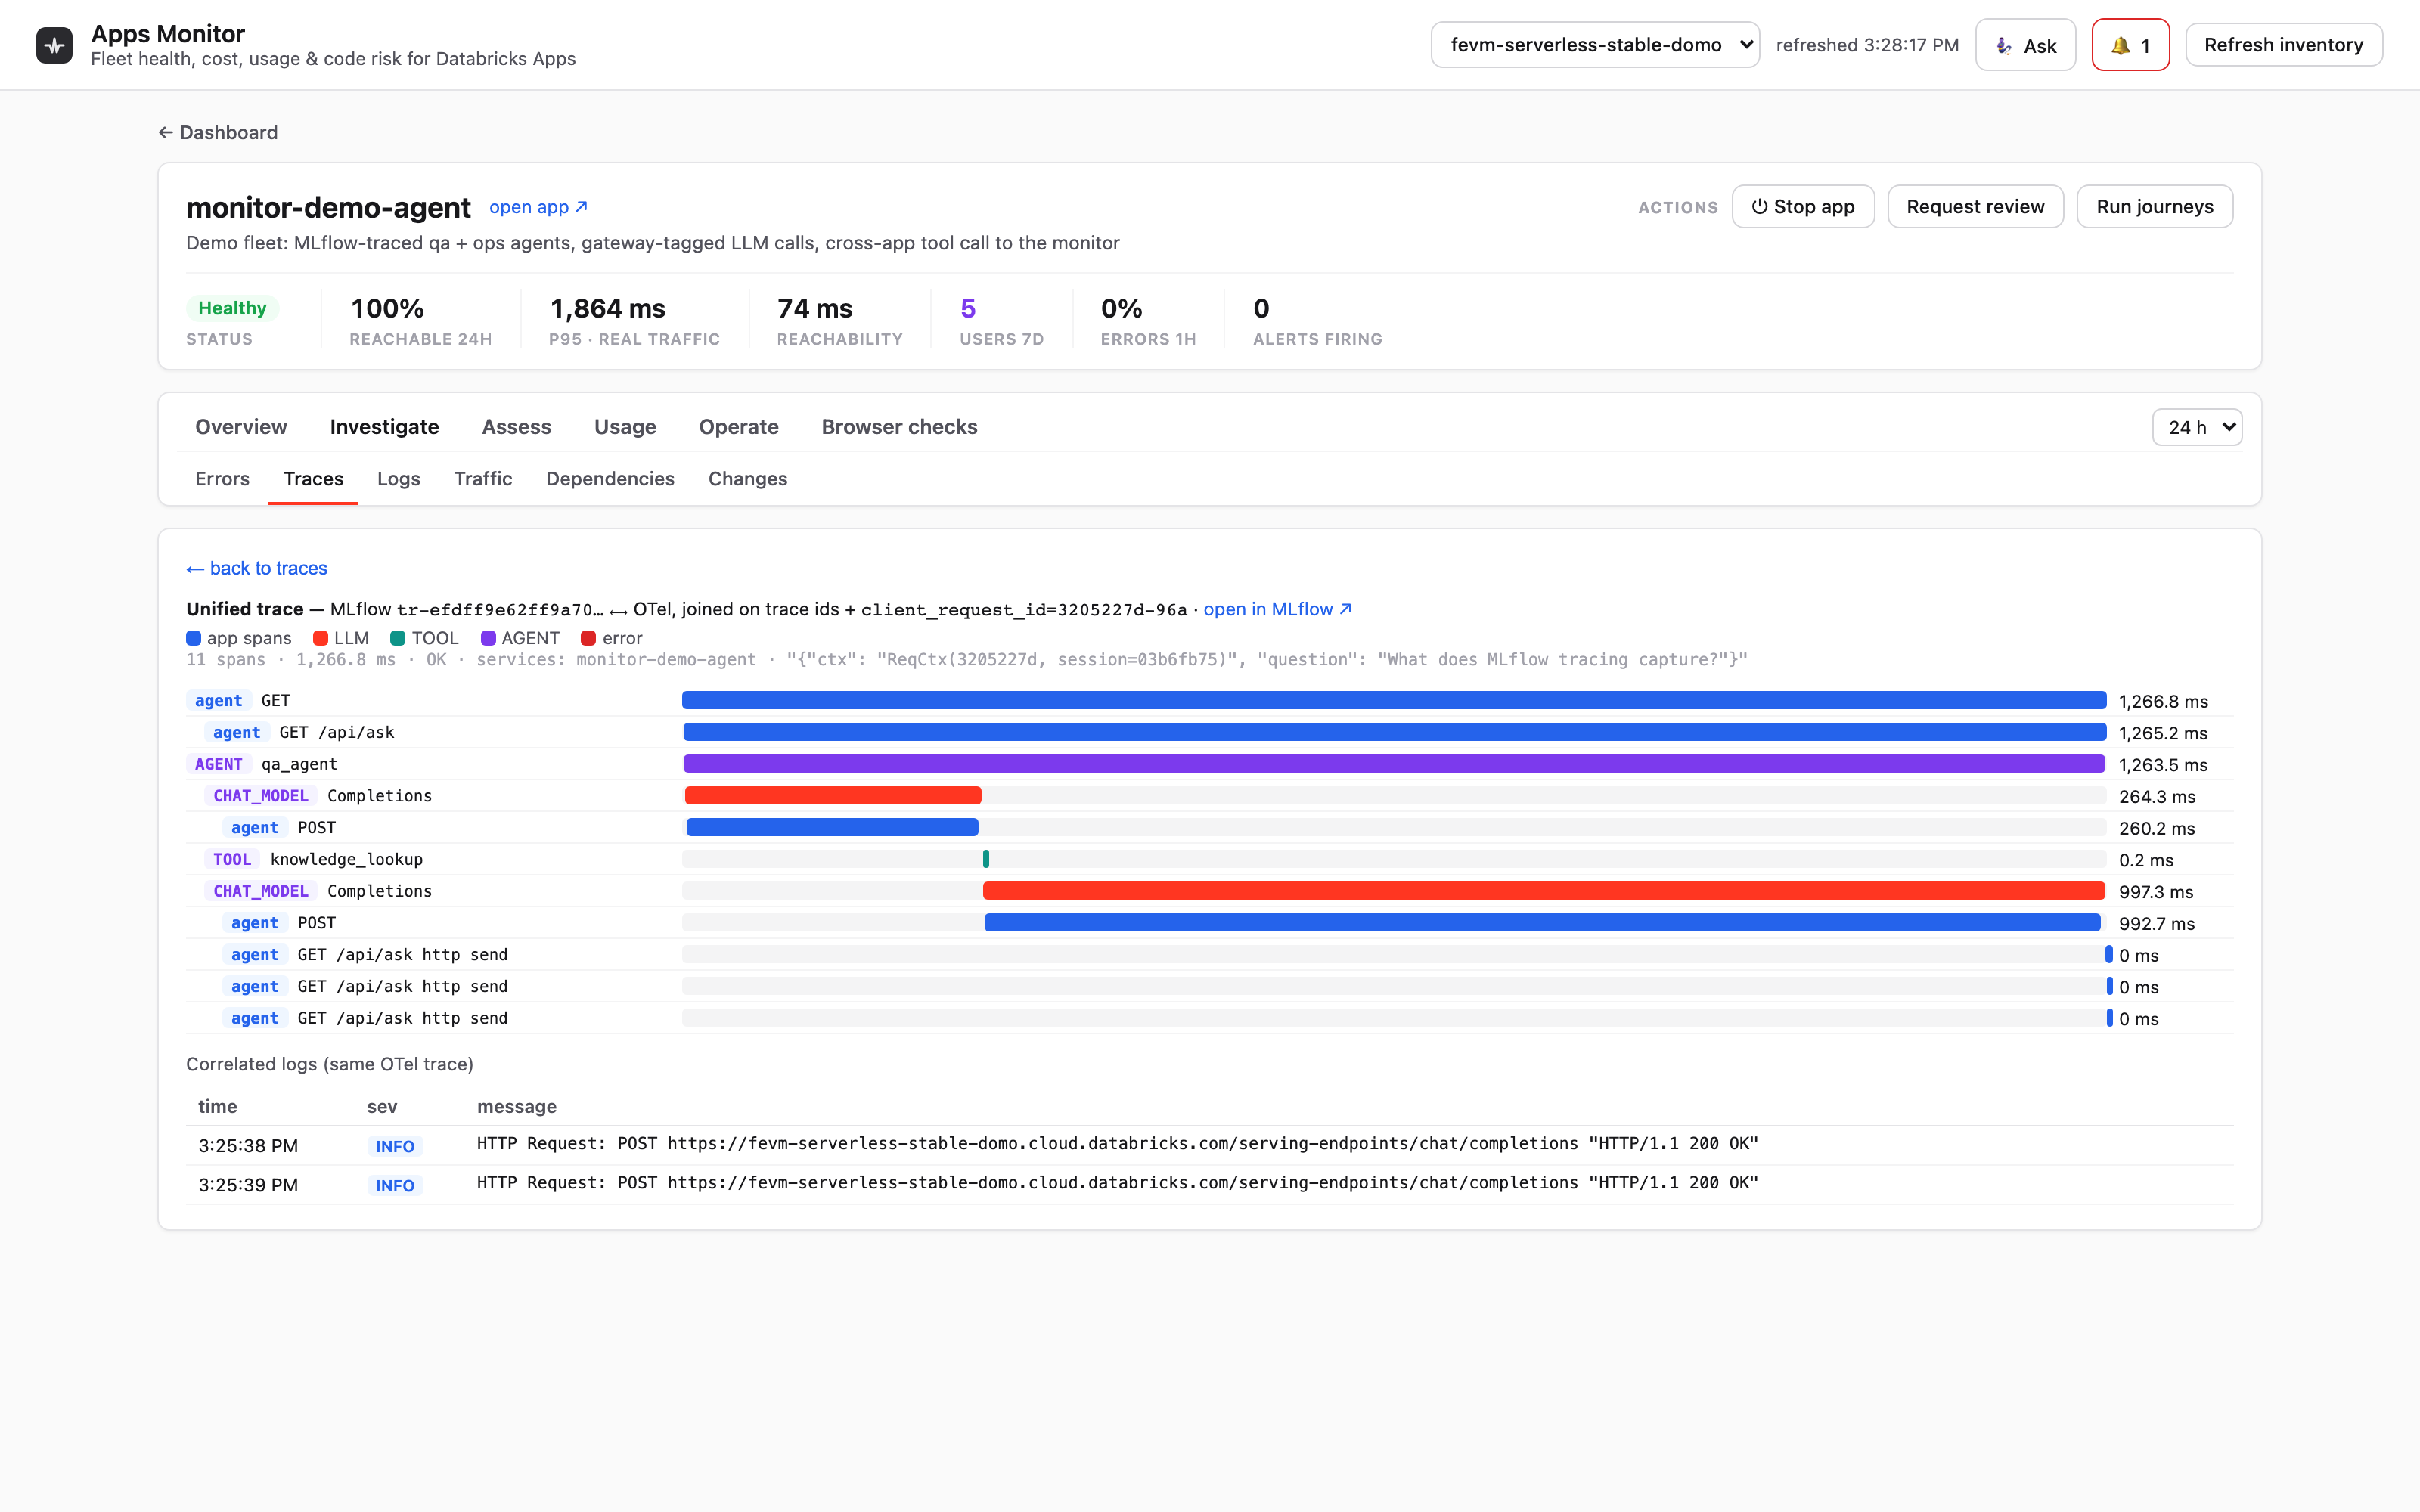
One /api/ask turn in the reference monitoring app: the MLflow trace ( tr-… ) and the OTel spans joined on trace ids + client_request_id—AGENT → CHAT_MODEL → TOOL spans in one waterfall, with the correlated request logs underneath.
Custom OTel metrics and cardinality
Beyond auto-captured request spans, add three instrument families:
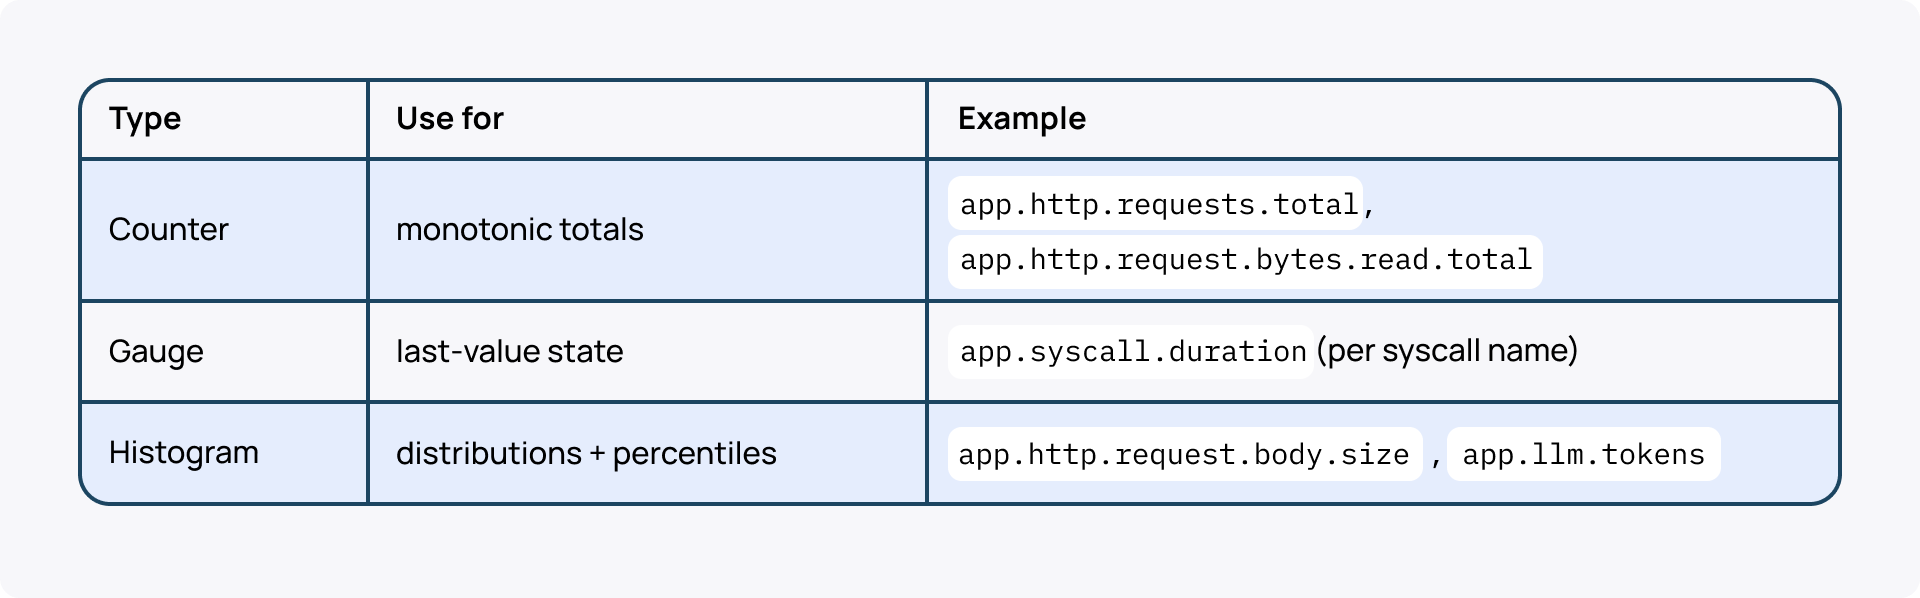
Apply the following cardinality rules (each unique attribute combination is one time series):
- http.route → templated path only, never raw URL.
- syscall.name, tool.name, model → literal enums.
- Never use user IDs, request IDs, raw paths, or query strings as metric dimensions. Log them as span attributes instead.
Histogram p95/p99 comes from bucket_counts + explicit_bounds via LATERAL VIEW posexplode—materialize nightly if heavy.
Multi-worker init
With Gunicorn/Uvicorn workers > 1, the opentelemetry-instrument wrapper initializes pre-fork and meters go silent in workers. Initialize TracerProvider + MeterProvider inside each worker from the app factory.
Databricks Apps cost: tracking, allocation, control
This is the FinOps and tech lead journey. It answers the questions: Who spends what? Will it stay within budget?
You can use governed tags to enforce cost visibility across every Databricks app, model call, and compute resource. So you can track all spend and prevent cost leaks before they happen.
Track what's exact, allocate the rest.
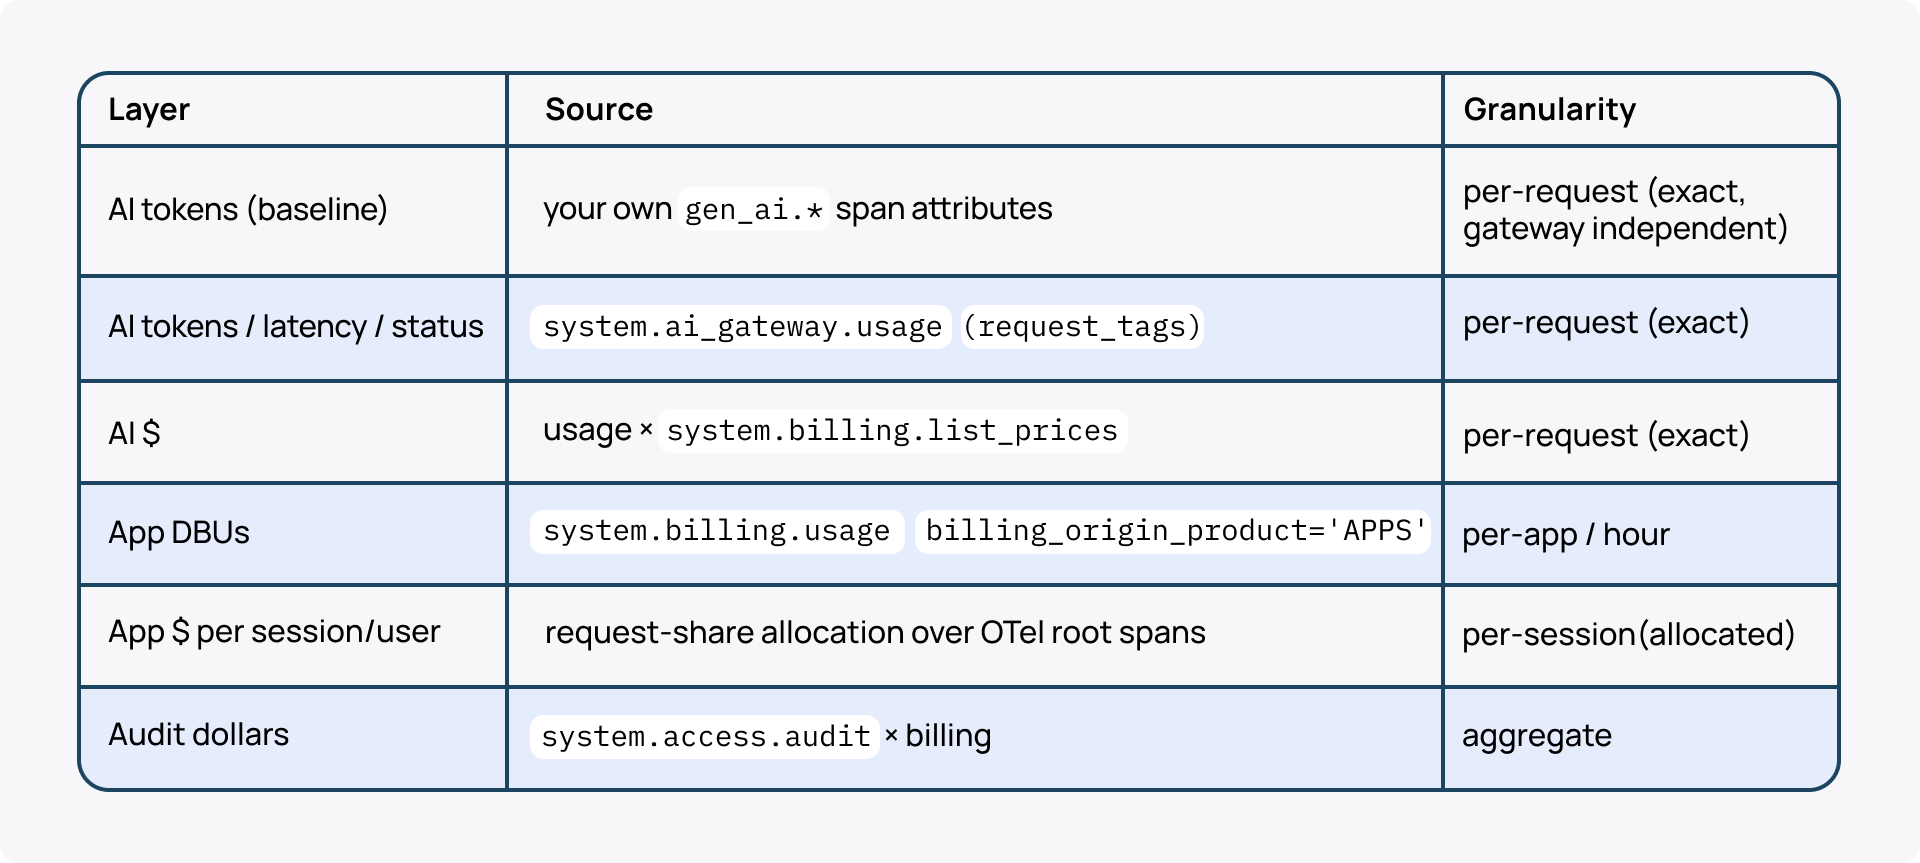
Allocation formulas (used in obs_costs):
ai_$_per_session    = endpoint_$_per_hour × session_tokens   / endpoint_tokens
app_$_per_session   = app_$_per_hour      × session_requests / app_requests
total_$_per_session = ai_$ + app_$
Two billing-join gotchas: system.billing.usage has no currency column. Join system.billing.list_prices with an explicit currency and price-validity window. System tables are account-wide, so filter workspace_id or fleet costs double-count.
LLM cost control
LLM spend scales in non-obvious ways. The costs of an agent making 30 model calls per task, running across 50 users daily, processing long documents, and retrying failed calls can double overnight when a new use case is added or a prompt inadvertently lengthened. At the ecosystem scale, costs become unmanageable without infrastructure specifically designed for attribution.
On Databricks, OBO authentication enables per-user cost tracking at the AI Gateway layer, making token consumption attributable to the individual rather than a shared service account. Sudden consumption spikes are also a security signal: they may indicate a runaway agent, an injection attack inflating context windows, or an unexpected retry loop.
Key metrics to track across all workloads:
- Token consumption (input and output separately) by model, application, user, and time period.
- Latency (p50, p95, p99) by model and application; degradation signals capacity or rate-limiting issues.
- Error rates by type: distinguishing rate limit errors, content policy rejections, timeout errors, and schema validation failures.
- Retry rates: high retry rates indicate systemic problems in prompt design or infrastructure.
- Cache hit rates: for applications with repetitive queries, semantic caching can dramatically reduce costs.
- Agent step counts: trends reveal efficiency degradation and potential runaway behavior.
For LLM-specific observability tooling:
- LangSmith for deep LangChain tracing with full prompt/response logging.
- Langfuse is a self-hostable open-source option for strict data residency requirements.
- Helicone as a transparent proxy requiring no code changes, useful for retrofitting observability onto existing deployments.
- Portkey combines observability with multi-provider gateway routing and fallback logic.
These tools provide model-call-level telemetry and complement platform-level governance.
Risks and cost controls for runway models
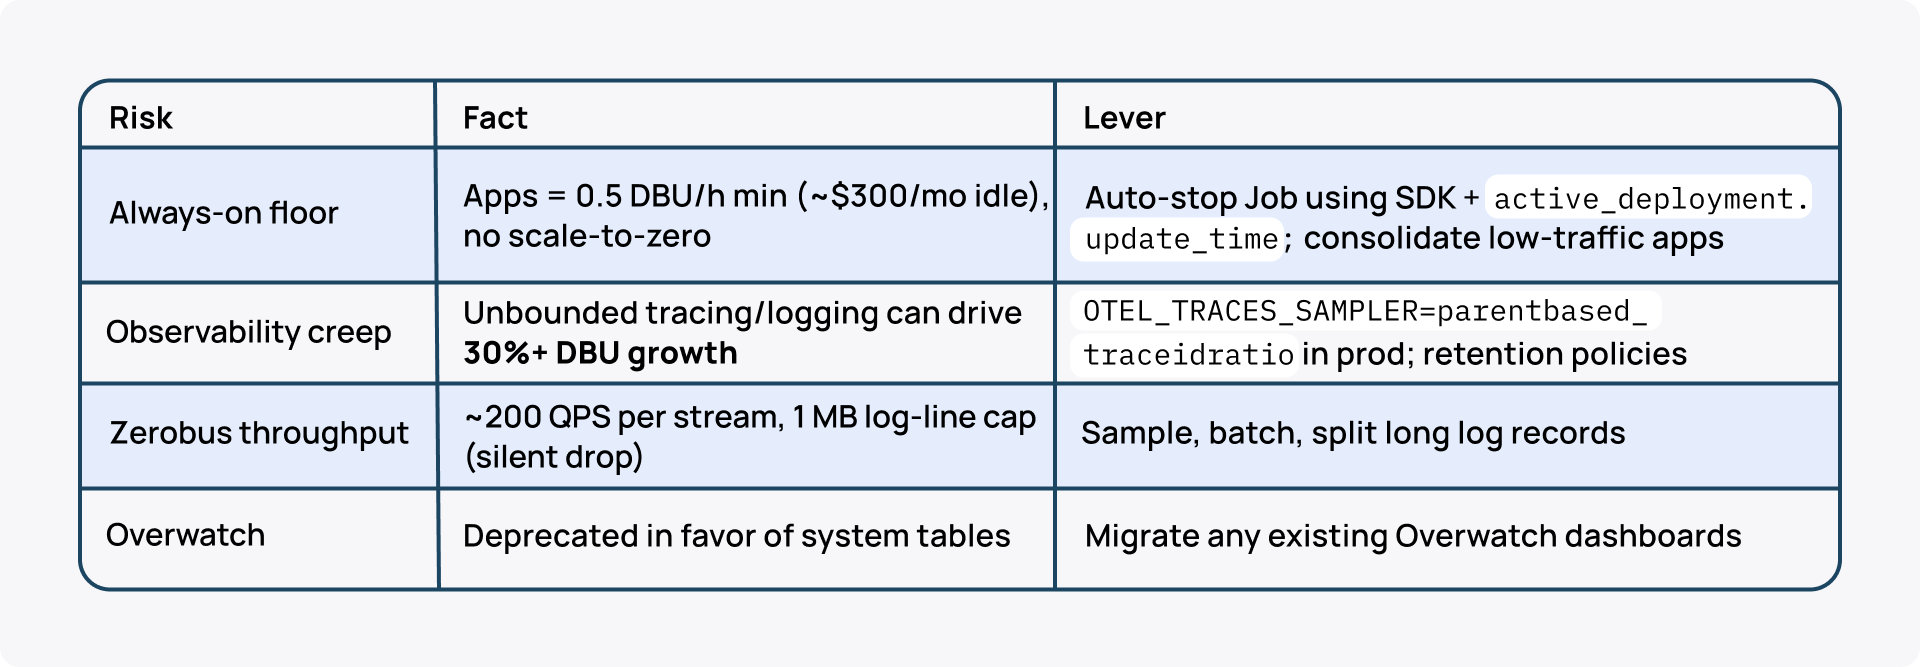
Governed Tags (GA) enforce required cost_center / team / app_name / env at deploy time; they flow through usage_metadata.custom_tags. Per-user, per-application, and per-team hard budget limits must be enforced from the first deployment, not retrofitted later.
Quality, evaluations, and feedback
Three feedback loops, all written back to MLflow traces: automated evals, custom domain scorers, and in-app user feedback.
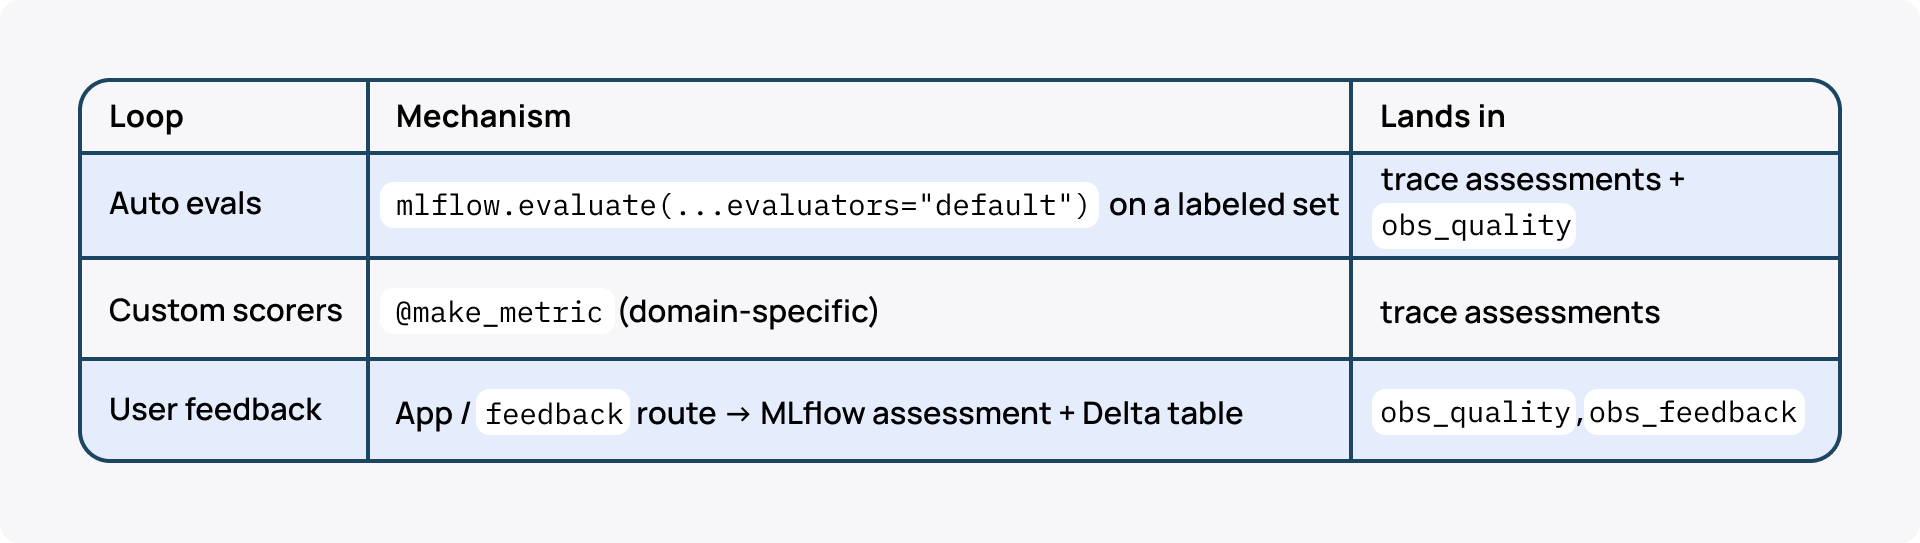
Built-in scorers cover relevance/faithfulness/toxicity. A/B test prompts with set_active_model() so traces link to the version that produced them. The MLflow Review App chat UI doesn't cover Apps agents—use a custom /feedback route.
This loop is live in the reference implementation. A nightly LLM judge scores each agent app's sampled production traces: the demo agent scored 9/10 relevance, 8/10 faithfulness, 0 toxicity over 10 traces, with a note that its ops summaries looked templated. This is a real finding, not a metric for a dashboard.
Multi-agent: keep traces stitched
When an orchestrator calls remote sub-agents across Apps, Serving endpoints, or Genie spaces, propagate the W3C traceparent header. Otherwise, spans become siblings and waterfalls break into disconnected fragments. AgentServer honors it automatically. Set OTEL_PROPAGATORS=tracecontext so outbound httpx / requests inject it too.
This unified logging and cost governance setup is part of the Apps Factory—a production-ready framework to safely build and run 100+ apps on Databricks. Download the playbook: 4 weeks to set up, 30% effort saved for every new app built.
How to run this setup in production
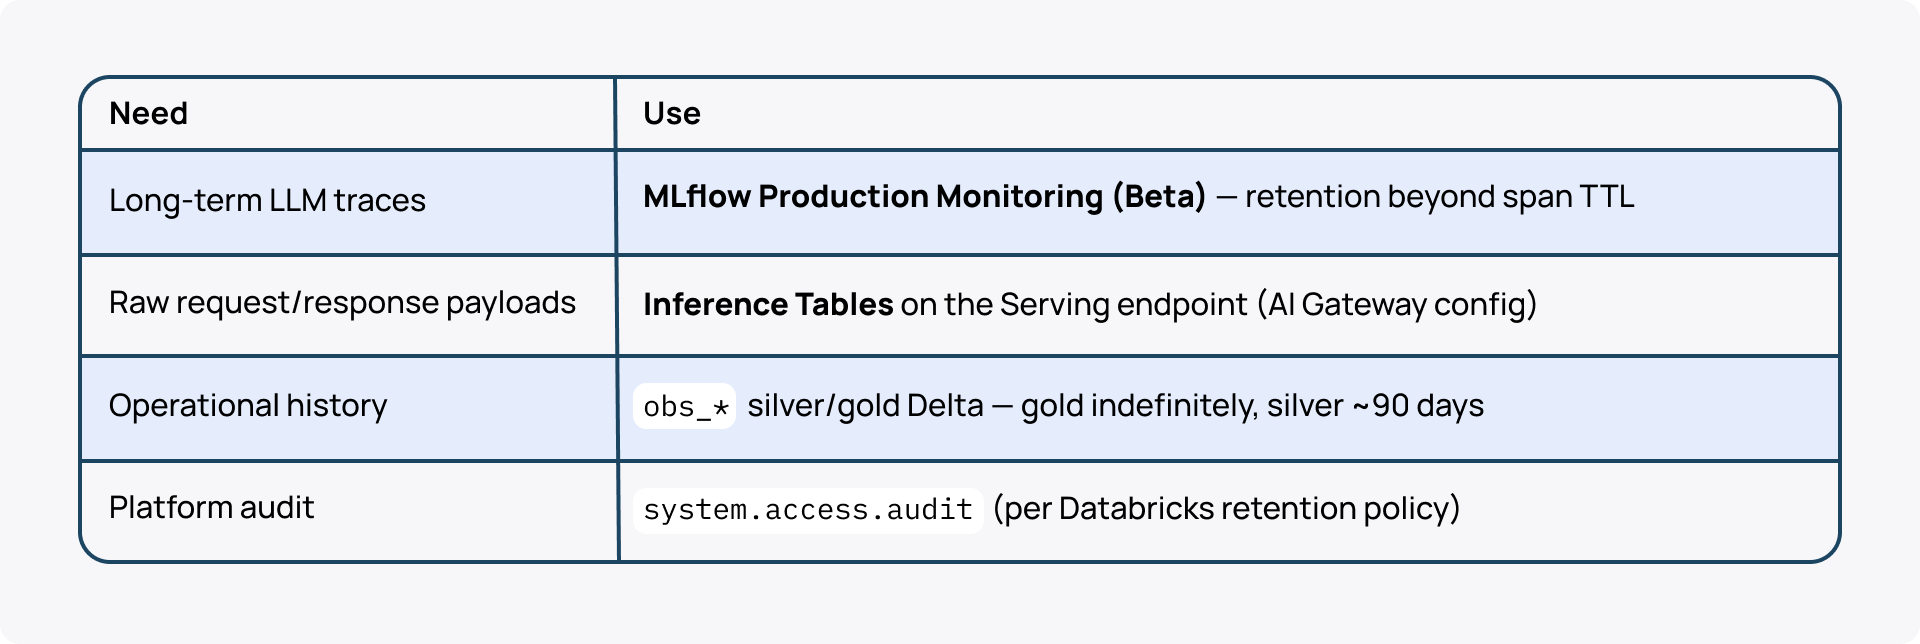
Long-term retention
MLflow span TTL is short. Compliance and regression testing aren't. Route long-term LLM traces to MLflow Production Monitoring, raw payloads to Inference Tables, and keep gold obs_* views indefinitely with silver at ~90 days.
Unity Catalog is the source of truth; external APM complements it for live alerting UX and cross-cloud correlation.
- No ddtrace agent in the Apps container. Datadog is OTLP/HTTP only.
- Dual-export from the OTel SDK: UC for FinOps, vendor for live alerting.
- Dual export for GenAI traces needs both flags—MLFLOW_ENABLE_DUAL_EXPORT and MLFLOW_TRACE_ENABLE_OTLP_DUAL_EXPORT—so traces reach both the MLflow experiment and the OTel pipeline. In UC, join them on client_request_id / the mlflow.traceRequestId span attribute (values arrive JSON-quoted), not raw trace_id equality.
env:
# OTEL_EXPORTER_OTLP_ENDPOINT is injected by the Apps runtime — never set it manually
- name: MLFLOW_ENABLE_DUAL_EXPORT
value: "true"
- name: MLFLOW_TRACE_ENABLE_OTLP_DUAL_EXPORT
value: "true"
Performance and load testing
Load test before you size: Databricks ships a first-party Locust framework for Apps agents.
- Step-ramp: 20-user increments, 30 s/level, up to 300; ~45 min total.
- Matrix: Medium @ 2/3/4 workers vs. Large @ 6/8/10.
- Mock the LLM (~800 ms) to isolate platform throughput; rerun end-to-end for SLO validation.
- Track TTFT as the streaming SLO, not just p95/p99.
- Pin locust>=2.32,<2.40—later versions hit silent RecursionError on long ramps.
- M2M OAuth for runs > 1 hour (U2M expires mid-test).
- Operate prod at 60–70% of measured peak—latency rises non-linearly near saturation.
How to cover a fleet of 100+ apps with one Job + one Monitoring App
This is the operator's daily sweep: Is the fleet OK? What needs me right now?
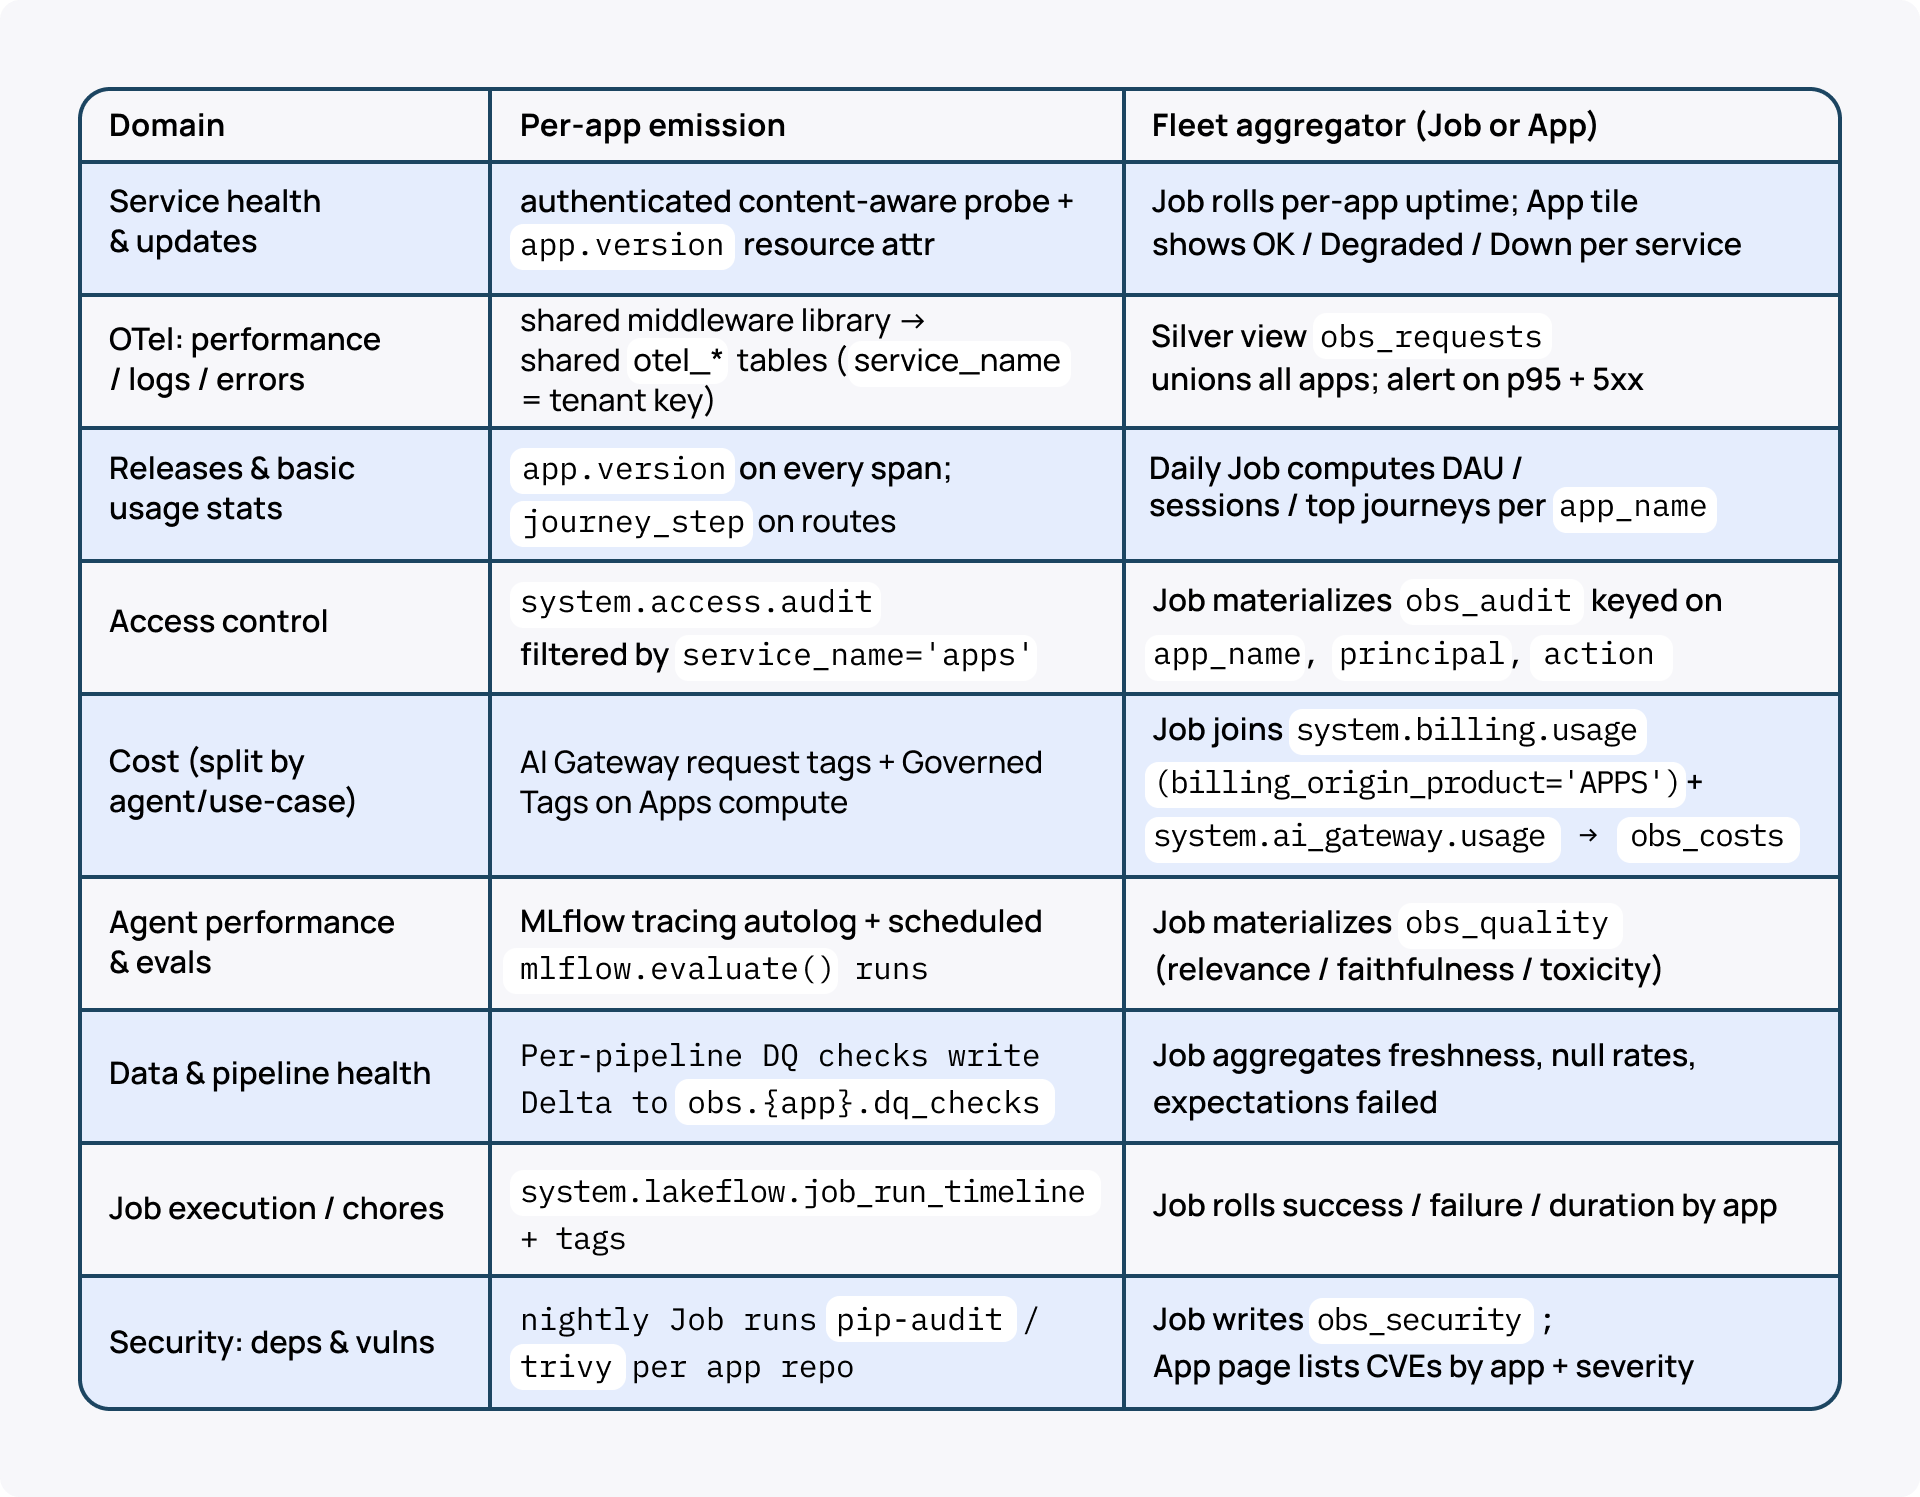
Per-app dashboards don't scale. The play: every app emits the same envelope into the same schema; one nightly Job + one Monitoring App build the cross-fleet picture.
Domain coverage and how each is unified
Fleet topology
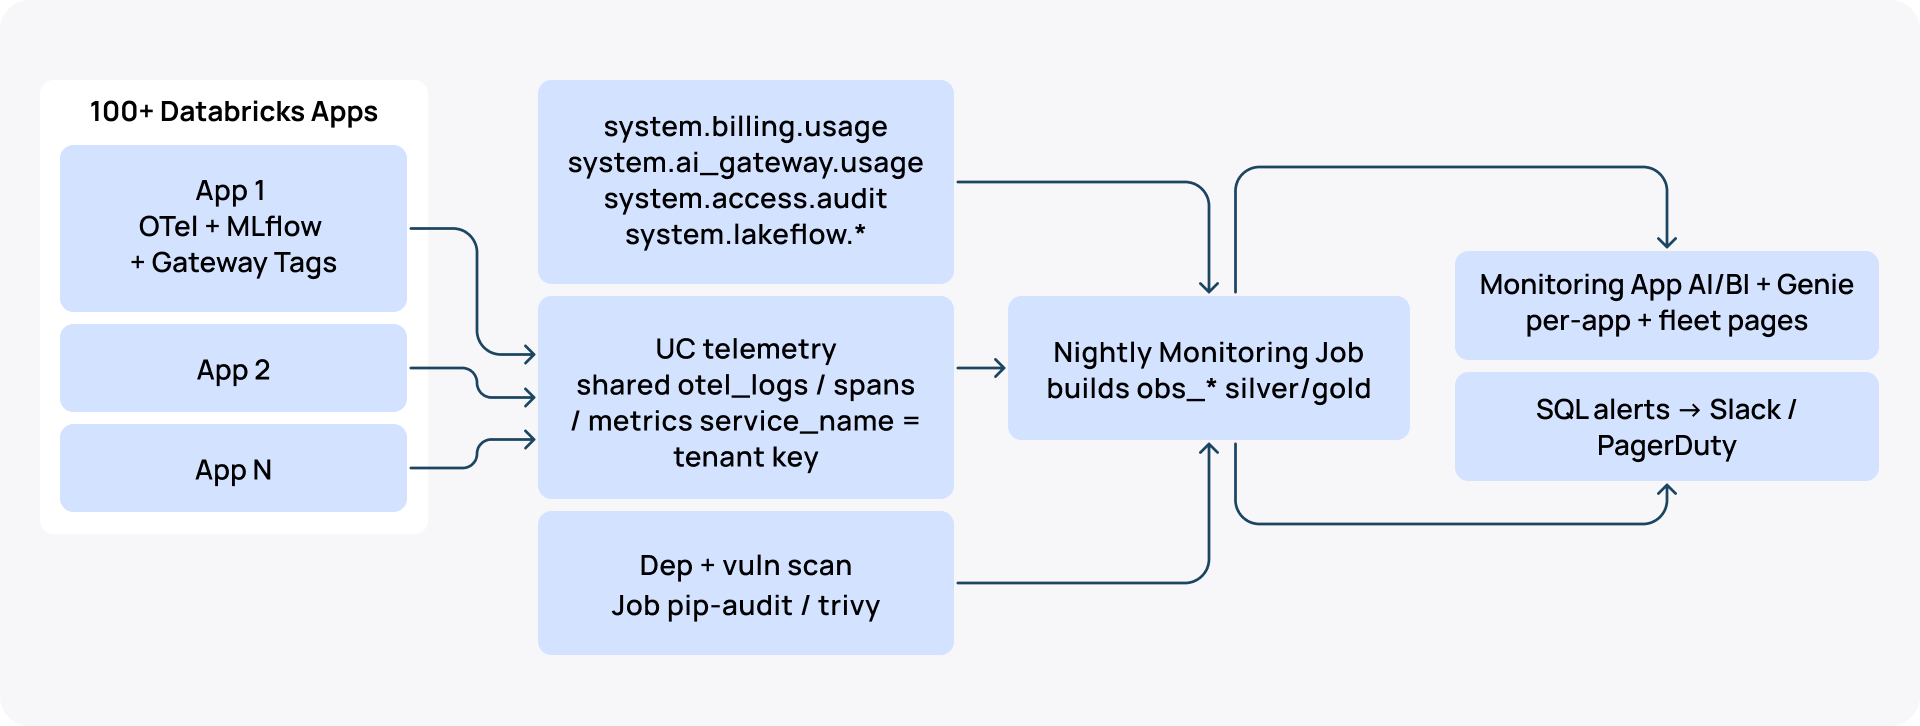
2 enforcement levers
In a fleet of apps, the expensive part isn't the coding. It's every decision about layering and wiring. A blueprint makes those decisions once; two levers keep it that way:
- Governed Tags (GA) enforce required keys (app_name, team, cost_center, env) at the catalog level. Apps can't deploy without them.
- Shared middleware library: one wheel every app pins, supplying the golden envelope, OTel root span, MLflow enrichment, and the Gateway tag helper. Standardization via dependency, not docs.
Fleet-wide alerting
SQL alerts over the gold views, parameterized by app_name. PagerDuty Event Hook delivery is ~90% with no retry, so keep an independent watchdog for tier-1 alerts.
What admins actually see
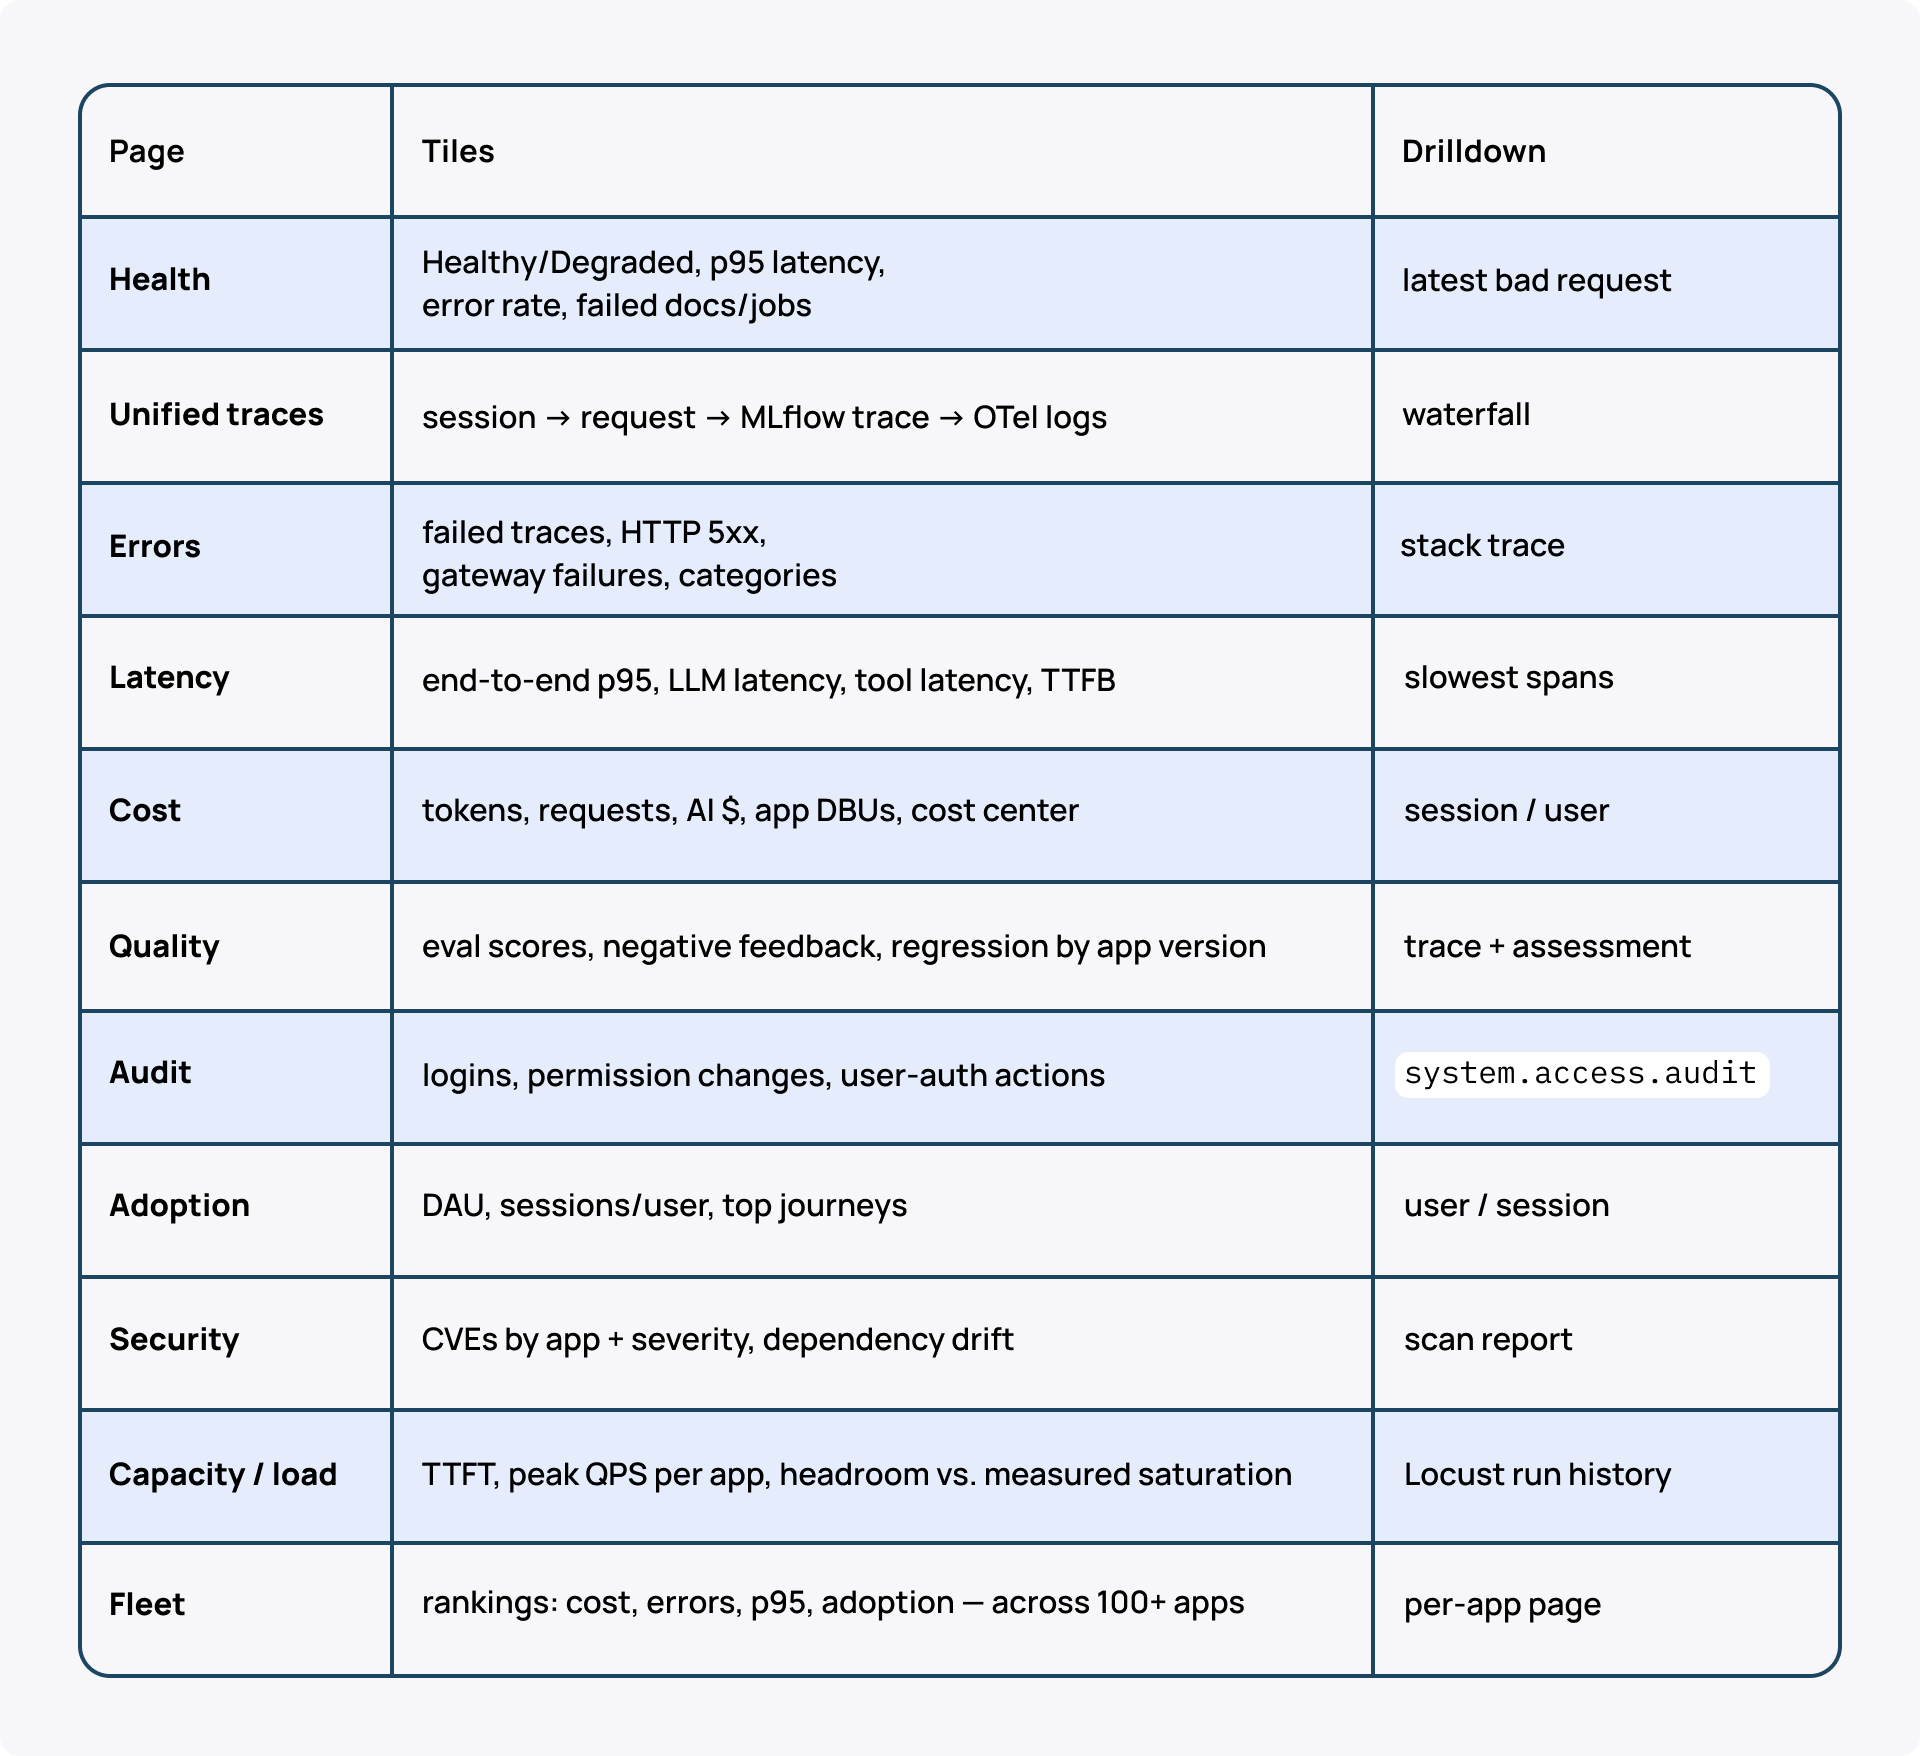
Two surfaces cover the admin journey: a Monitoring App for the fleet view (one row per app) and the AI/BI Dashboard + Genie for per-app drilldown with natural-language Q&A. One Monitoring App surfaces fleet-wide health, unified traces, errors, latency, cost, quality, audit, adoption, security, and capacity for Databricks Apps. Each page has a structured tile view and a drilldown to the individual request, session, or span that needs attention.
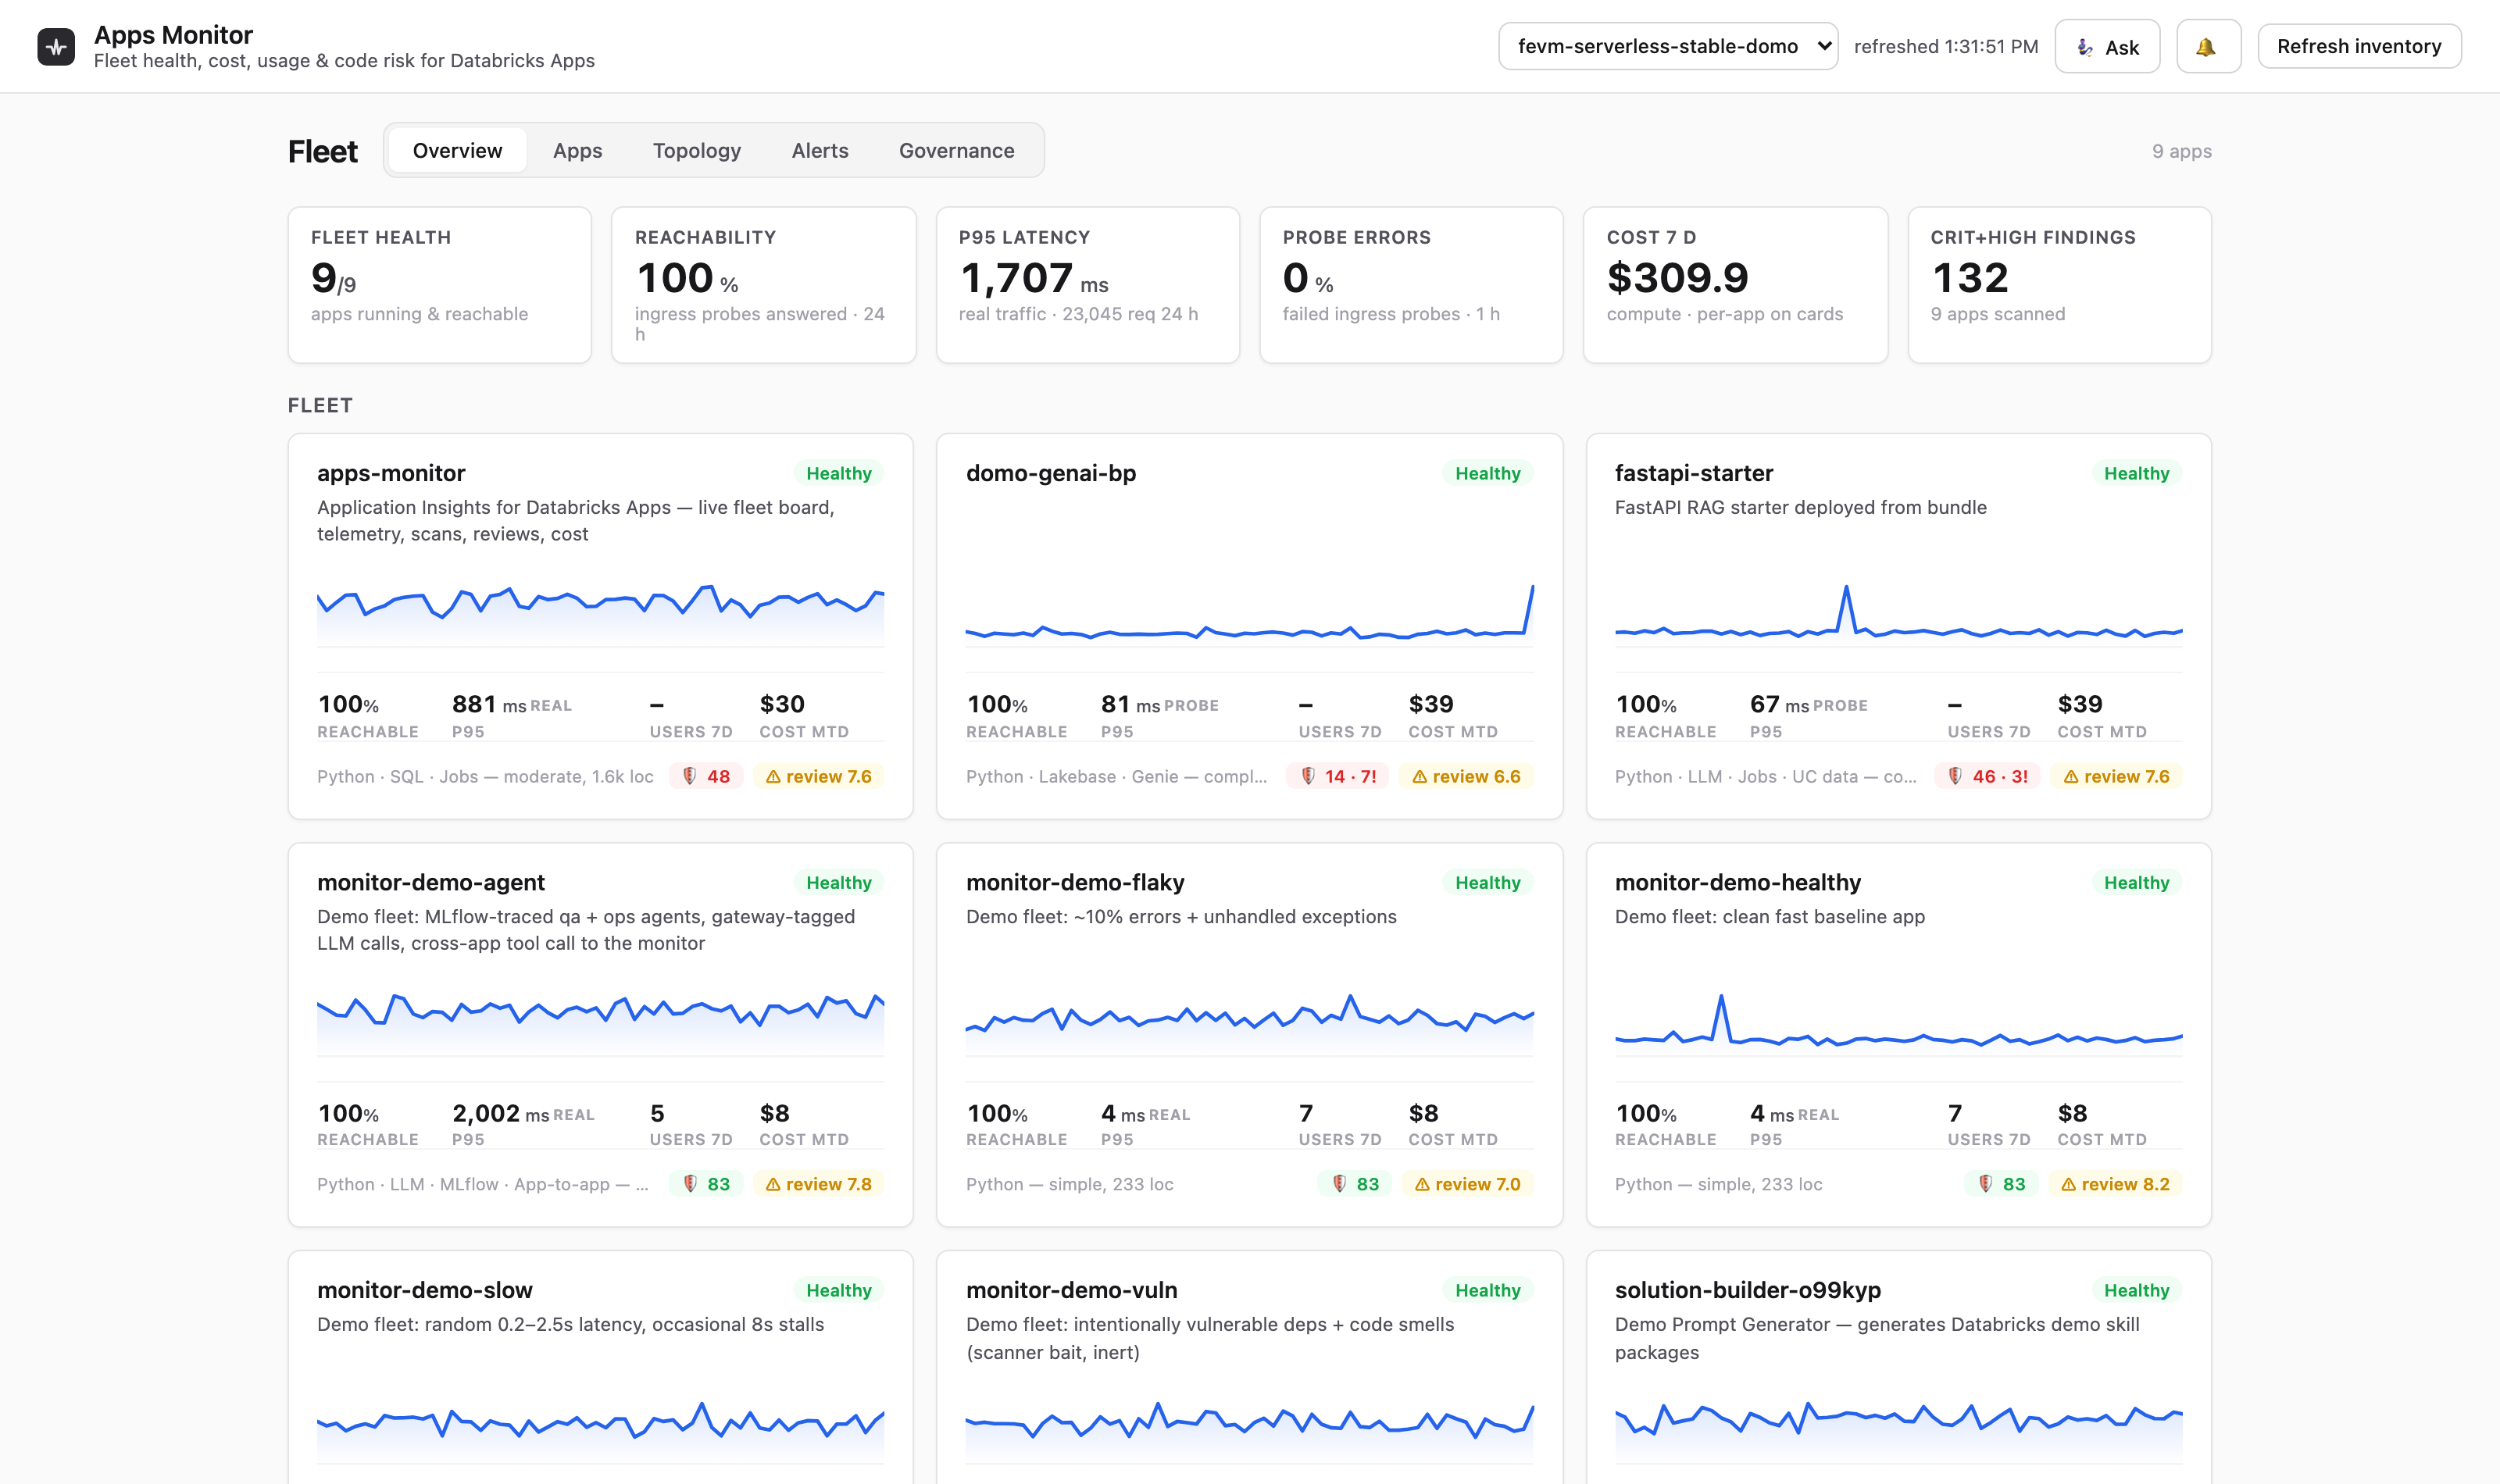
The reference Monitoring App's fleet view: reachability, real-traffic p95, users, cost and code-risk signals for every app on one screen.
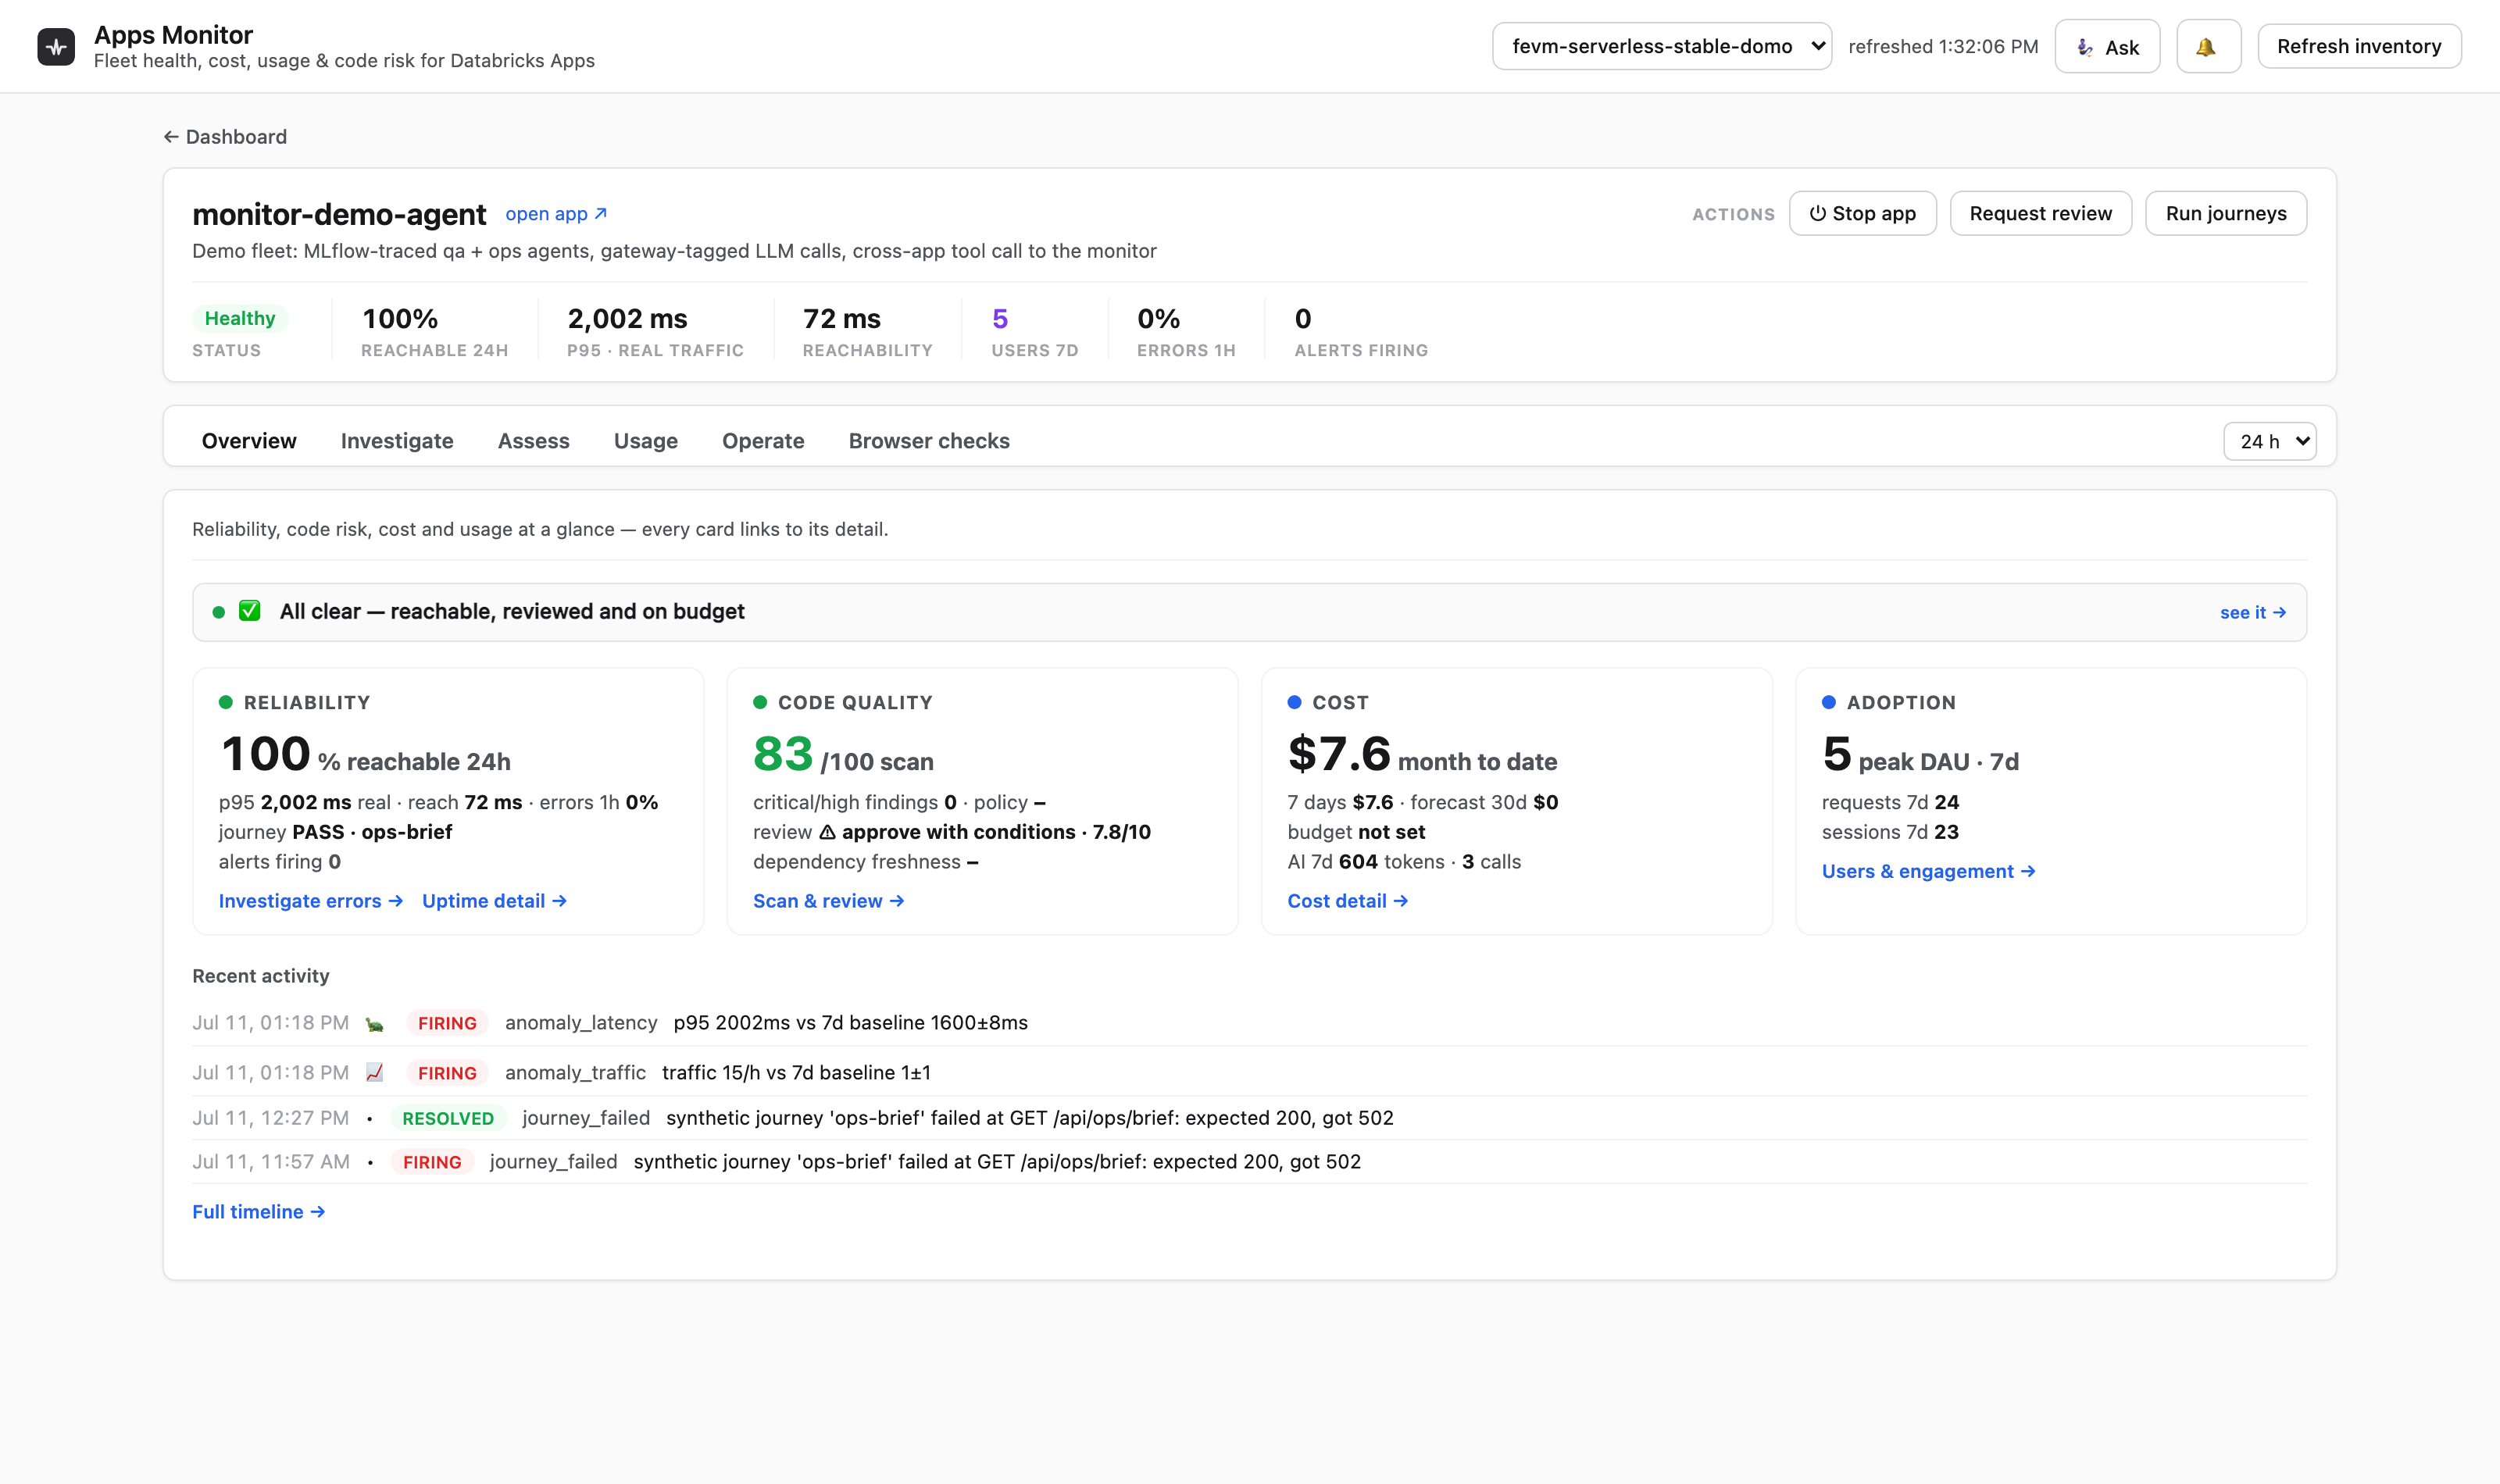
Per-app drilldown: reliability, code quality, cost and adoption on one scorecard, with recent activity.
When I showed this during my stage talk at DAIS, it existed only as a concept without a link. databricks-apps-monitor is now public: a monitoring app, inventory/scan/review/eval/cost jobs, bundle-managed SQL alerts and Lakeview dashboard. Plus, a five-app demo fleet, all deployed from two bundles. Beyond the views, it ships the levers: 60-second authenticated probes, hard budget auto-stop, a dead-man watchdog on its own telemetry, and one-click provisioning of pre-wired apps.
Minimal implementation pattern
Three code snippets, one per layer:
1. OTel middleware: stamp the envelope on the request span
@app.middleware("http")
async def observability_context(request, call_next):
   rid = request.headers.get("X-Request-ID") or str(uuid.uuid4())
   sid = request.cookies.get("session_id") or str(uuid.uuid4())
   uhash = hash_user(request.headers.get("x-forwarded-user", "unknown"))
   with tracer.start_as_current_span("app.agent_turn") as span:
       span.set_attribute("app.client_request_id", rid)
       span.set_attribute("session.id", sid)
       span.set_attribute("user.id", uhash)
       return await call_next(request)
Stamp the envelope on the current, auto-instrumented request span. Opening a second root span inside middleware detaches it from the request trace.
2. MLflow: enrich the agent trace
mlflow.update_current_trace(
   client_request_id=rid, session_id=sid, user=uhash,
   tags={"app": "claims-admin", "cost_center": "finance-ai"},
)
3. AI Gateway: tag every model call
client.chat.completions.create(
   model="claims-agent-gateway", messages=msgs,
   extra_headers={"Databricks-Ai-Gateway-Request-Tags": json.dumps({
       "user_id": uhash, "session_id": sid, "client_request_id": rid,
       "app": "claims-admin", "cost_center": "finance-ai",
   })},
)
Data model for unified logging and cost governance
Every signal from every app lands in the same three-tier schema: bronze for raw ingestion, silver for cleaned and joined views, gold for the KPIs and cost breakdowns that power dashboards and alerts.
bronze: app_otel_logs · app_otel_spans · app_otel_metrics ·
       mlflow_trace_unified · system_ai_gateway_usage ·
       system_billing_usage · system_access_audit · system_lakeflow_* ·
       inference_tables · locust_results

silver: obs_requests · obs_sessions · obs_agent_spans ·
       obs_errors · obs_latency · obs_costs · obs_audit ·
       obs_quality · obs_feedback · obs_data_quality ·
       obs_security · obs_capacity

gold:   admin_health_kpis · user_session_costs · latency_breakdown ·
       top_journeys · audit_trail_report · fleet_rankings ·
       ai_cost_by_team_model
System tables update throughout the day, not in real-time. Use them for daily dashboards. Middleware + OTel + MLflow drive near-real-time.
AI/BI Dashboard + Genie Space for per-app drilldown
Two surfaces sit on top of obs_* gold pointed at the same SQL, so the structured view and the natural-language conversation never diverge.
AI/BI Dashboard (Lakeview)
The Lakeview artifact (.lvdash.json) is committed in the repo and deployed via DAB—no UI drift.
# bundles/observability/resources/dashboard.yml
resources:
 dashboards:
   fleet_observability:
     display_name: "Fleet Observability — ${var.env}"
     file_path: ../dashboards/fleet.lvdash.json
     warehouse_id: ${var.warehouse_id}    # serverless Small is enough
     parent_path: /Workspace/Shared/observability
Wire each page to the gold model, never to bronze:
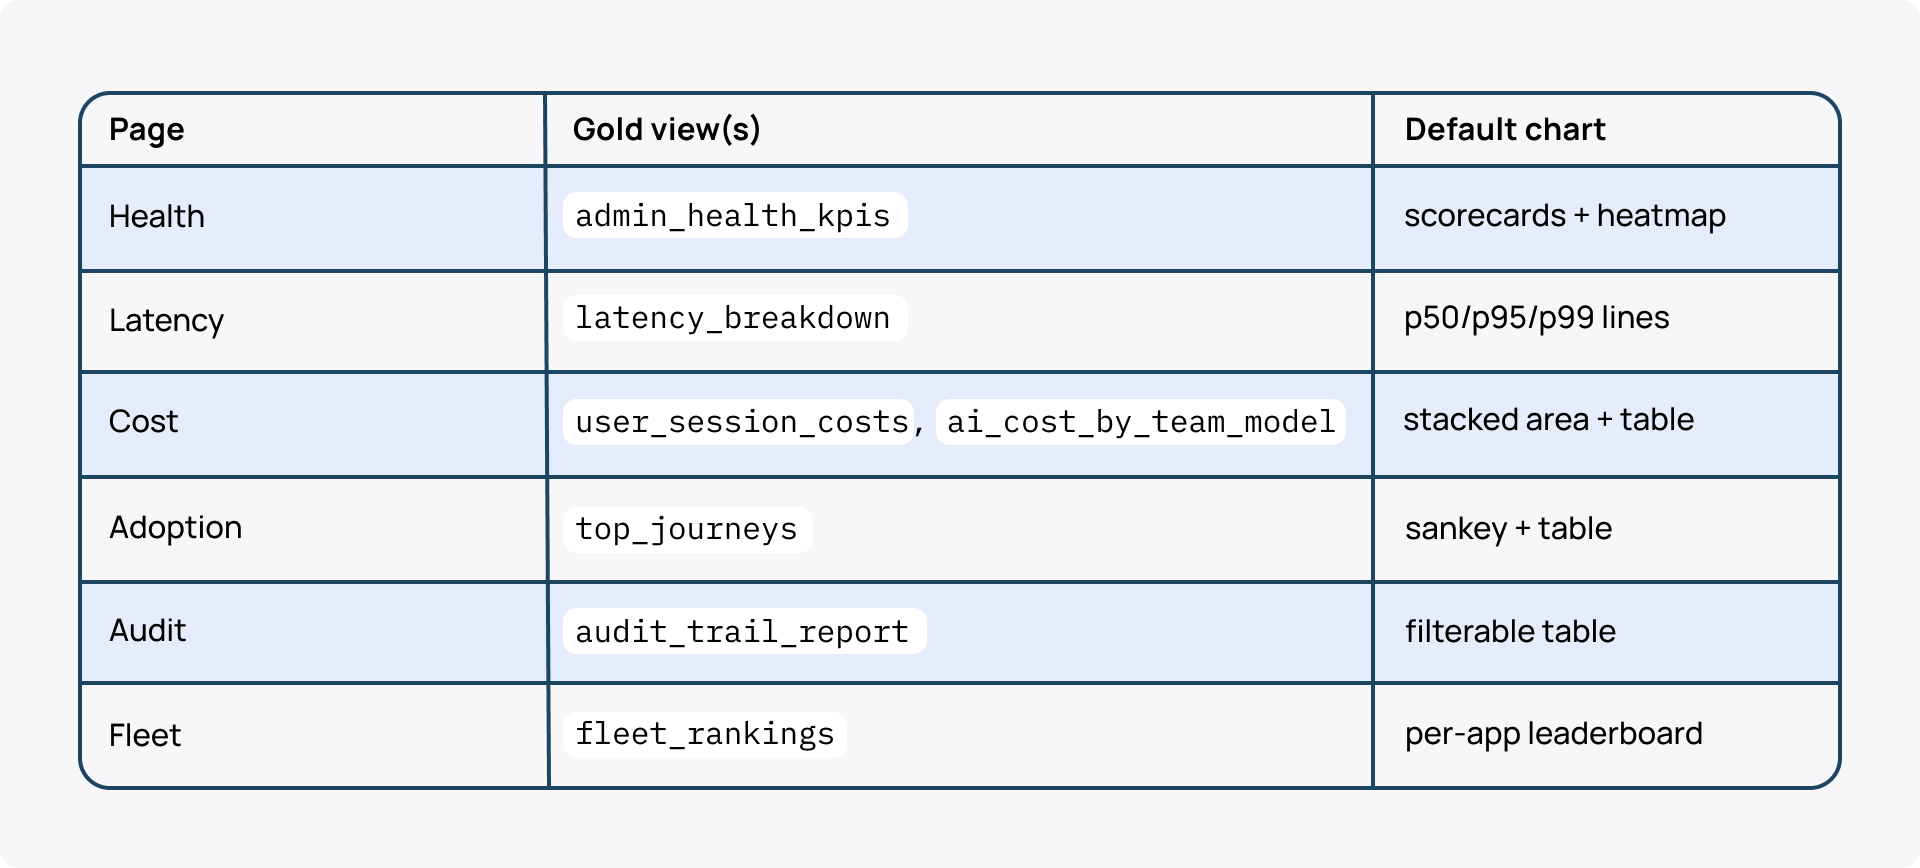
Dashboard-level parameters propagate to every widget, so one definition covers 100+ apps:
:app_name    — multi-select (ALL sentinel) over DISTINCT app_name
:time_window — Last 1h / 24h / 7d / custom
:env         — dev / staging / prod
App owners see the dashboard filtered to their app_name; platform admins see the fleet. SQL alerts ship in the same bundle and reference the same views.
Genie Space (natural-language Q&A)
Published AI/BI dashboards can include a companion Genie Space. Genie translates "Which apps grew AI cost >50% week-over-week?" into SQL over the dashboard's datasets and cites the rows it used.
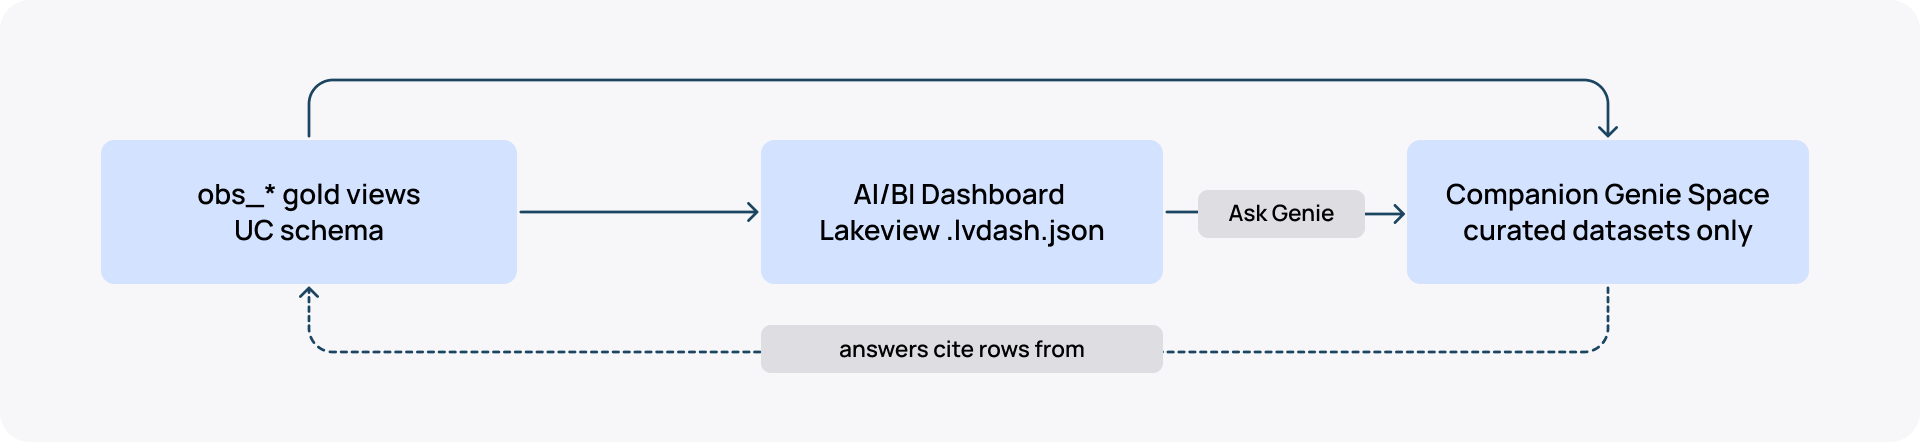
Here’s a real answer from the companion Genie Space of the reference implementation:
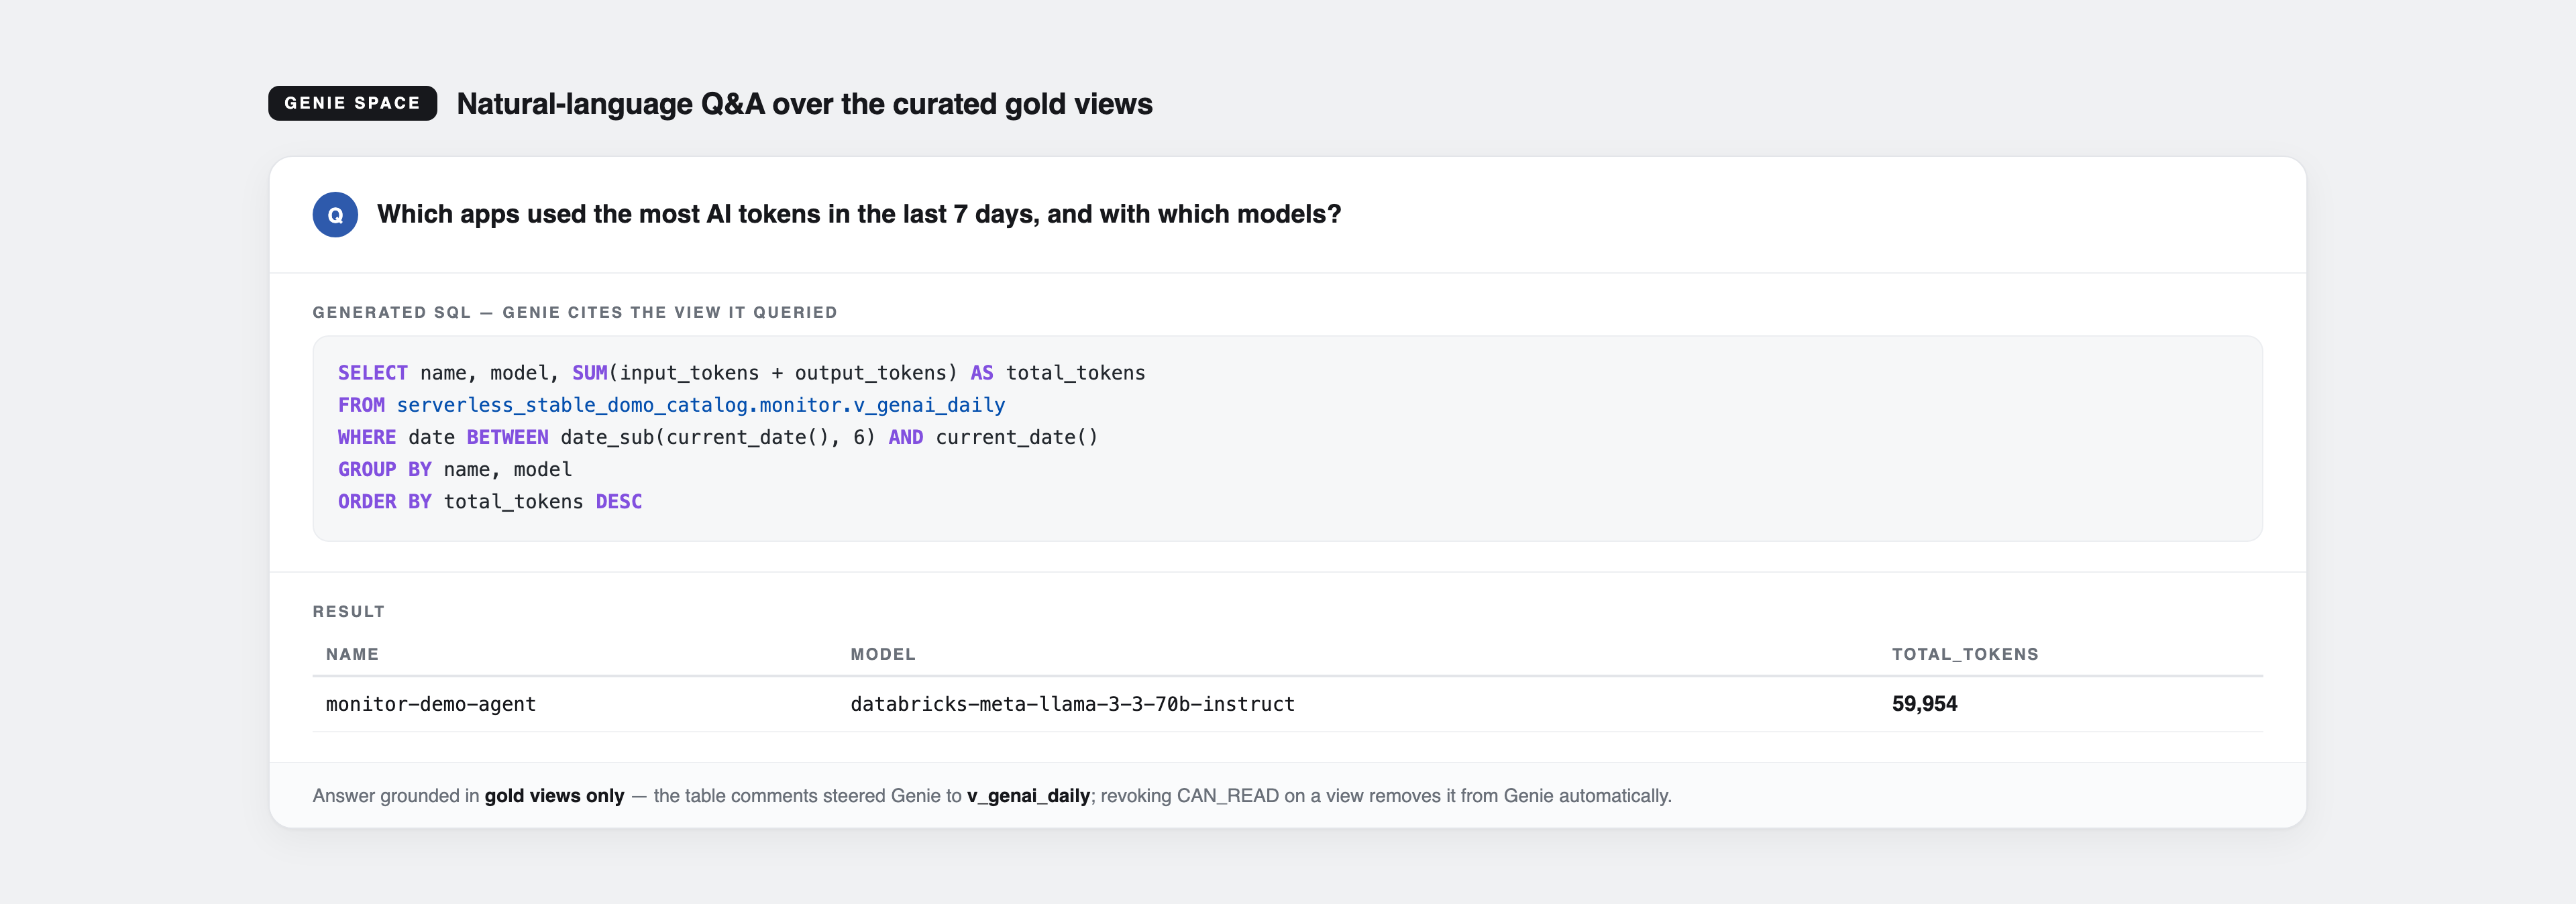
Genie translated the question into SQL over v_genai_daily—the gold view its table comment describes—and cited the rows it used.
Three things determine answer quality:
- Semantic metadata. COMMENT ON TABLE / COMMENT ON COLUMN per gold view—Genie reads these to disambiguate cost_center from team.
- Curated examples + glossary. Pin 5–10 representative questions and term definitions; without this Genie hallucinates joins.
- Tight schema. Only gold views—never otel_logs, otel_spans, or raw system tables.
The curation rule is the security boundary:
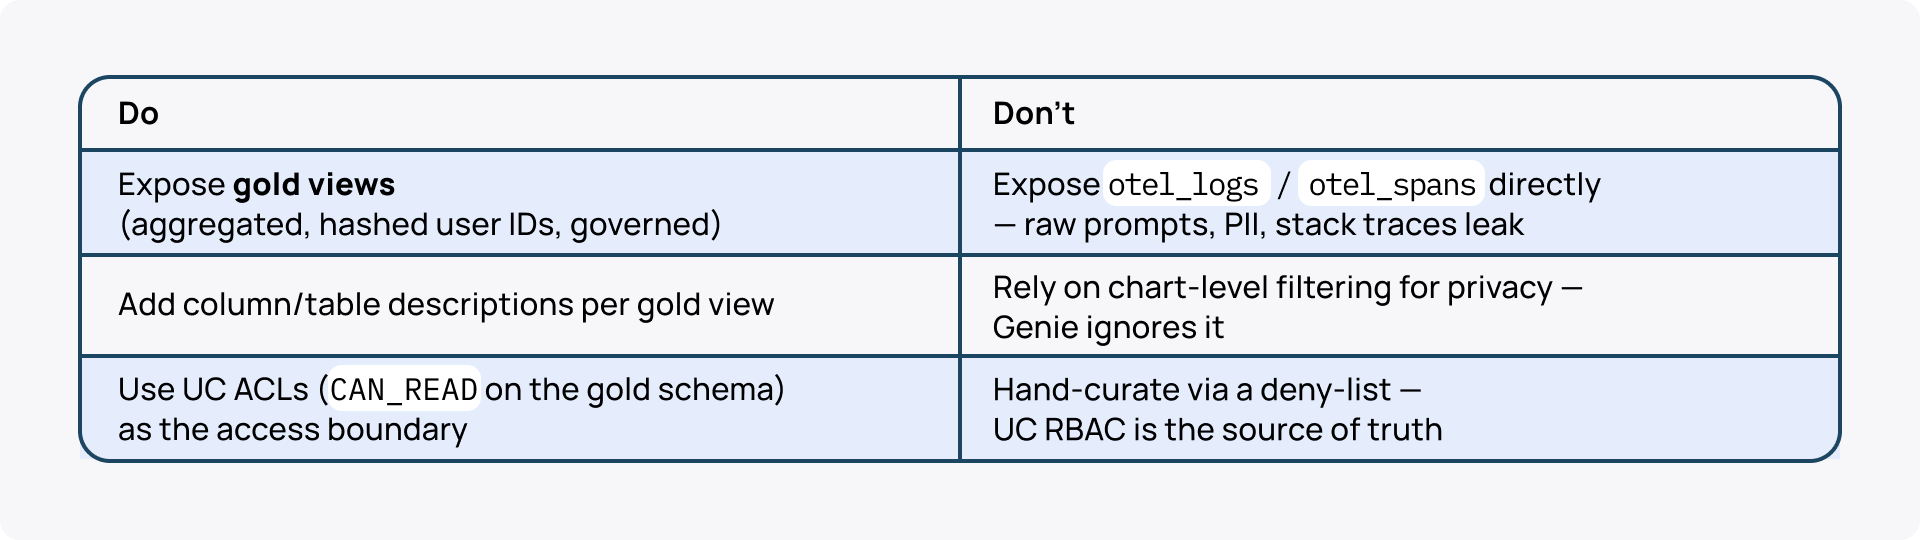
Genie answers from the full underlying dataset, not chart-visible fields. Revoking CAN_READ on a gold view removes Genie access automatically.
Why this stack works for 100+ apps
- One dashboard, many tenants. :app_name + UC row filters serve every team from one Lakeview—fleet ranking and per-app drilldown from one artifact.
- Versioned and reviewable. .lvdash.json + DAB → PR review, no drift between environments.
- NL scales tier-1 triage. Most "Is my app OK?" or "What did we spend?" questions get answered by Genie without an engineer touching SQL.
- Same SQL, two surfaces. What's on the dashboard is exactly what Genie can answer, no semantic divergence.
How App Spaces and this setup work together
The recently announced App Spaces provide a Databricks-native governance layer. This is a unified container where you can see which apps exist, who created them, what compute they're consuming, and what resources they're bound to. That's a huge step forward for organizations dealing with an expanding ecosystem of apps built across many teams.
But App Spaces is a container, not a wired-in observability system. You still have to build the operational intelligence on top of it: the governed tags, the shared middleware, the bronze → silver → gold model.
This setup for Databricks Apps cost tracking and unified logging is what you need to get the operational intelligence tailored for the specific context and unique ecosystem of your org. The entire setup is runnable today; check it out here: github.com/Paldom/databricks-apps-monitor.
Building applications on Databricks at scale? Check the Apps Factory playbook to see how you can set up an operational layer fully tailored to your org's needs to run and govern apps at scale (templates, patterns, policies, quality gates, and observability setup included).